A few weeks ago I posted about vibe coding a travel planner with GitHub Copilot:
Developing applications have truly come a long way when I compare my university days of writing applications with Java. Like many others in the technology profession, I do fear that vibe coding would lead to many new developers (if that’s what they would be called in the future) not learning the underlying mechanics of how coding actually works. How the future of development looks is anyone’s guess but it is such a great experience in the present.
I’ve recently been keeping an eye on a few ETFs and stocks as I plan for this year’s investments and remembered that one of the personal projects I never got to years ago was to develop an application that allowed me to track stocks. I’m aware that there are plenty of these applications out there but my requirements were simple as I had a very limited set of requirements for what I wanted it to do. So over a Sunday afternoon, I used my GitHub Copilot to vibe code a personal stock dashboard that follows the same Google design that doesn’t require an account, a brokerage connection, or a monthly subscription.
The result is a single index.html file you open directly in a browser. No install, no build step, no backend. This post walks through what it does and how the vibe coding session went.
The Design
I only follow a handful of stocks that are a mix of Canadian, US equities, and a few index funds. Nothing exotic. The problem is that every app I’ve tried tend to either require me to have an account, sign up, or too complicated for what I want it for. All I really wanted was to open a page, see my tickers with sparkline charts, check how they’re doing today versus last week or last year, and track a rough position value. Something I can pop open in a browser tab like a dashboard. Since this seemed relatively simple to develop and was something I never got to in the past, I figured I’d just build this month before my premium credits expire from GitHub Copilot.
What Does the App Actually Do?
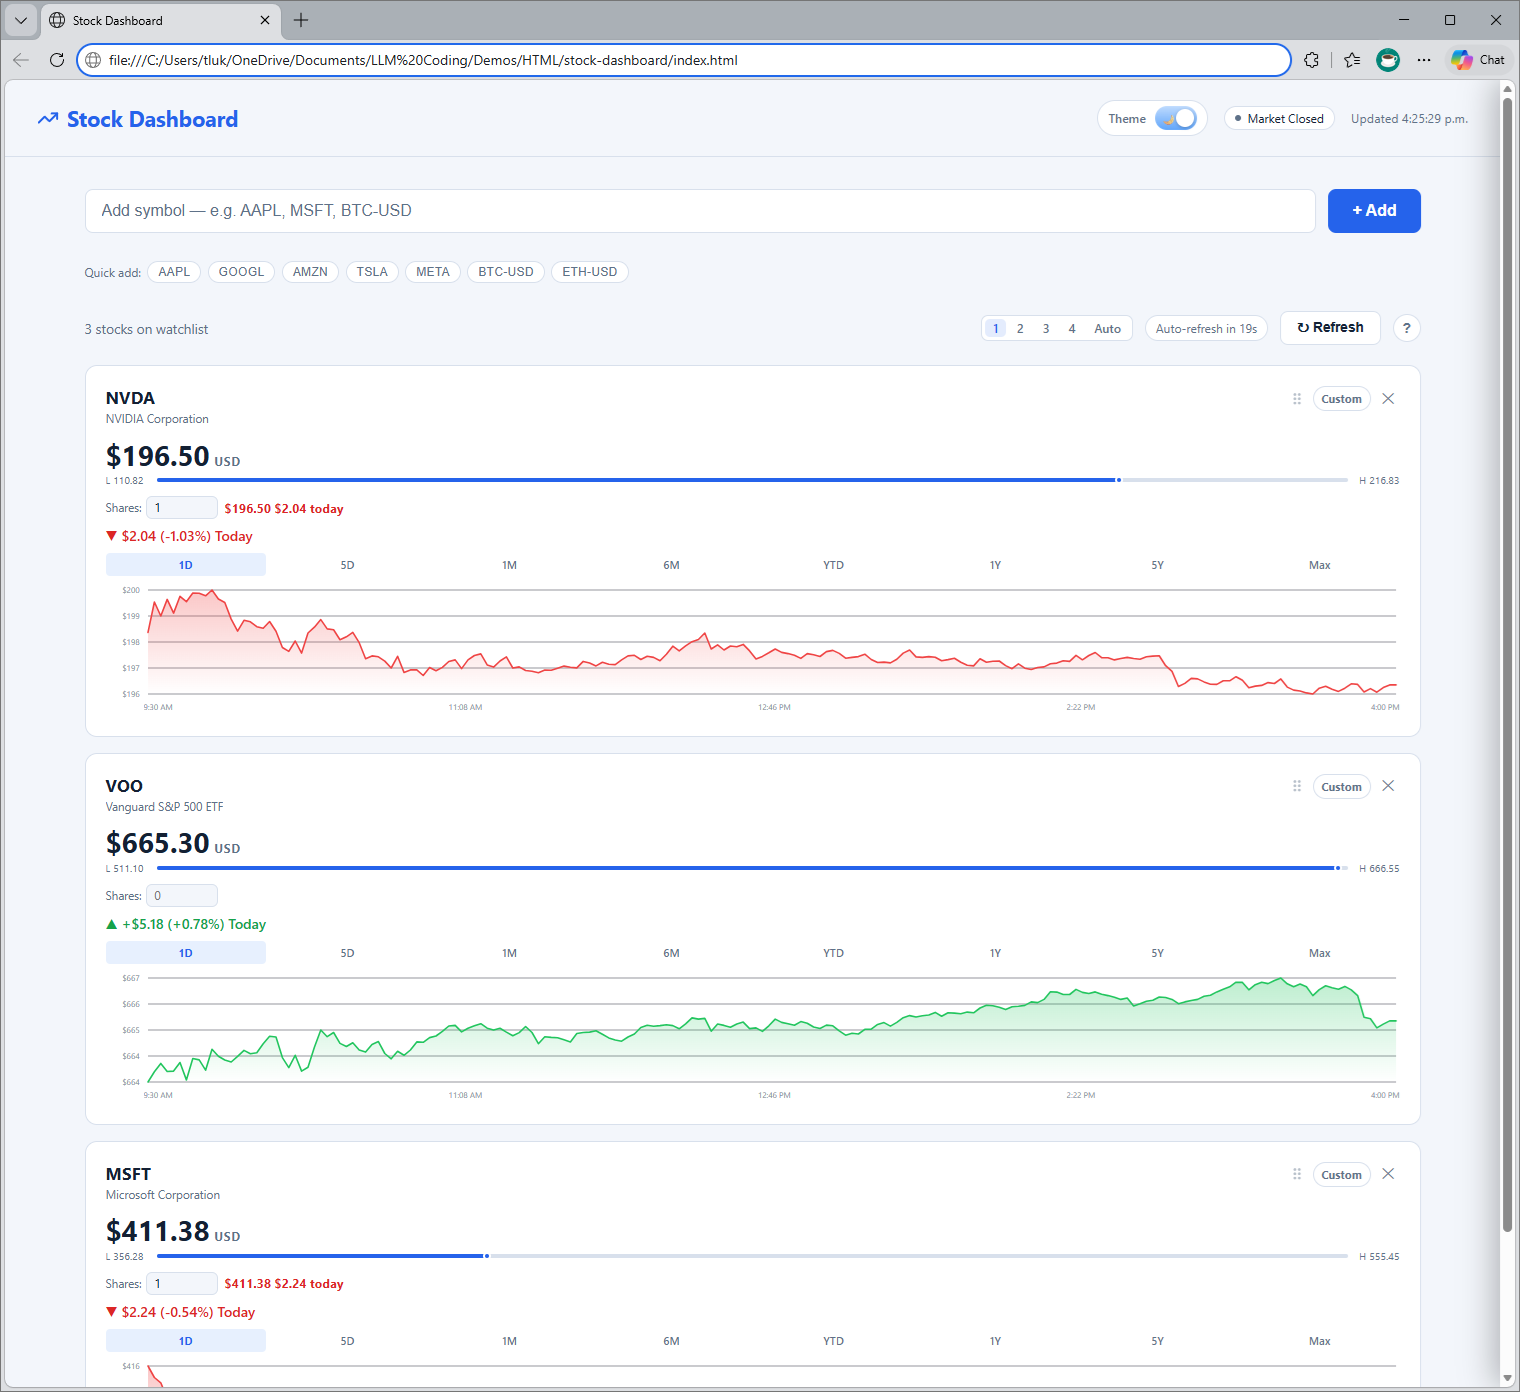
The dashboard is a single index.html file you open directly in a browser. Market data is pulled from Yahoo Finance through a CORS proxy, so there is no backend, no API key, and nothing to configure.
Here’s what it gives you:
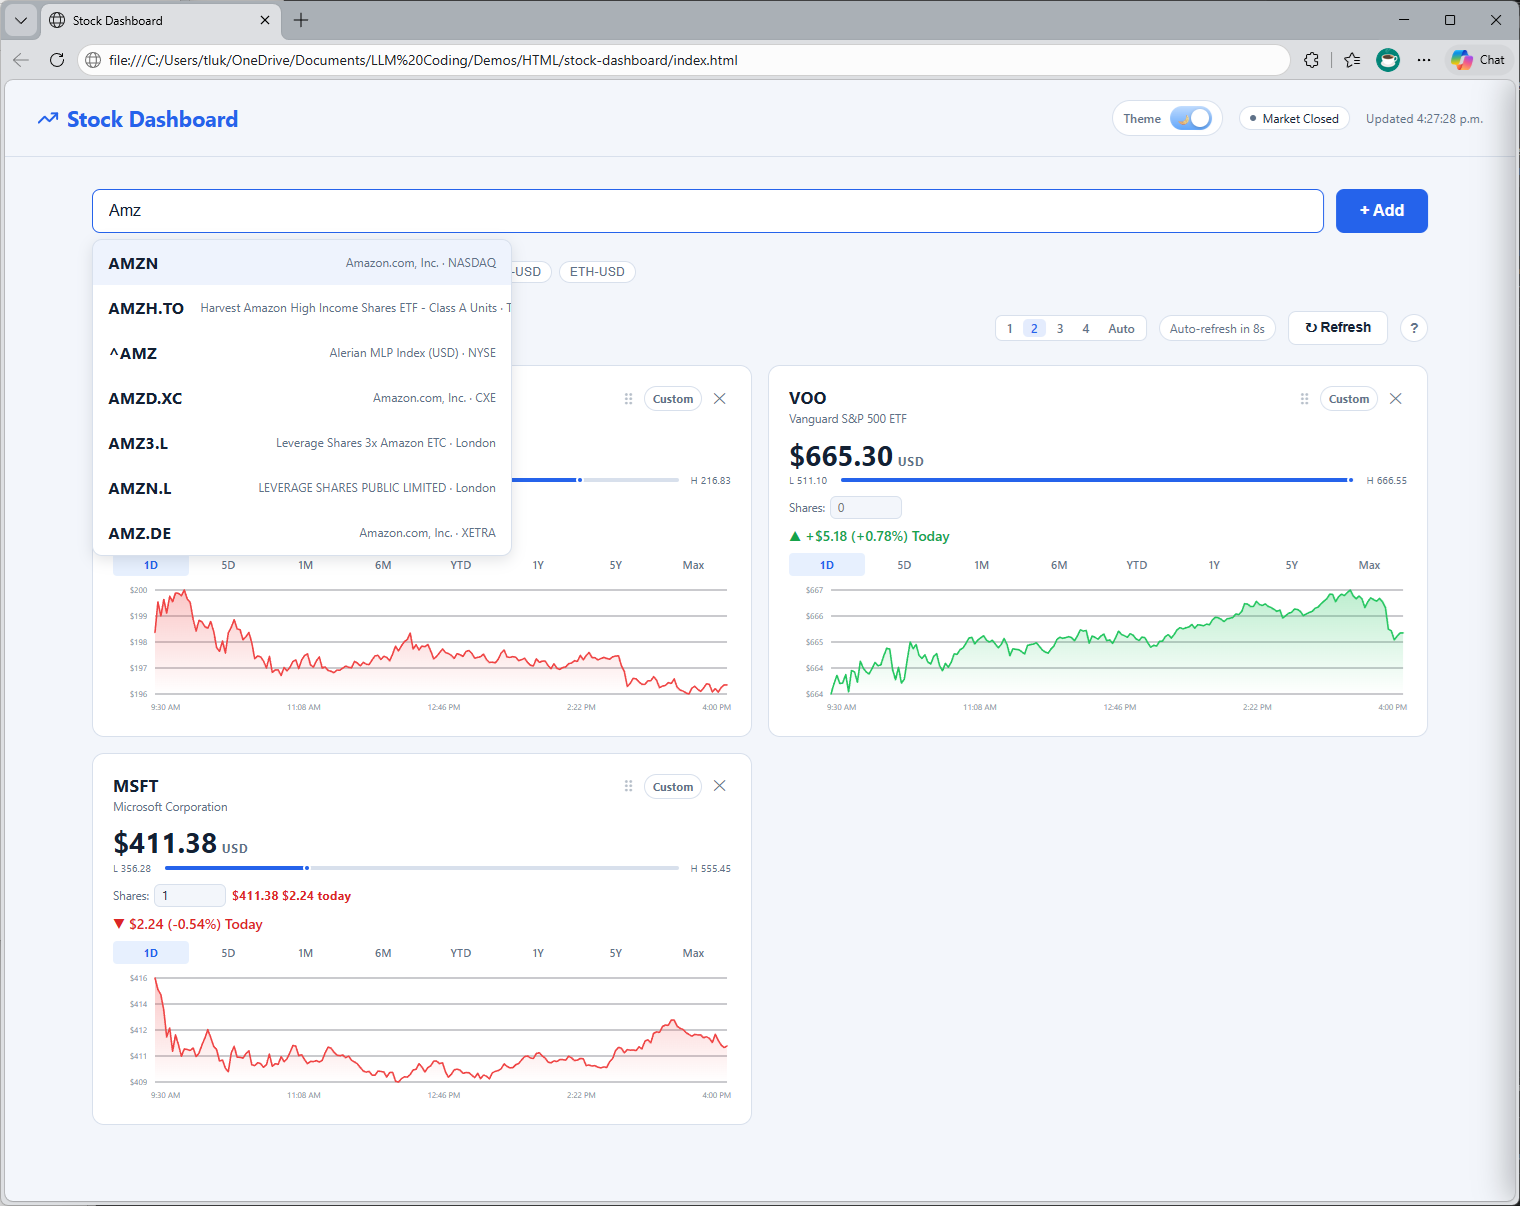
- Live ticker search with autocomplete — type
AAPL,MSFT,NVDA,BTC-USD, orBMO.TOand pick from the results. Invalid symbols are rejected automatically. - Sparkline charts per card — each stock card shows a chart with selectable ranges:
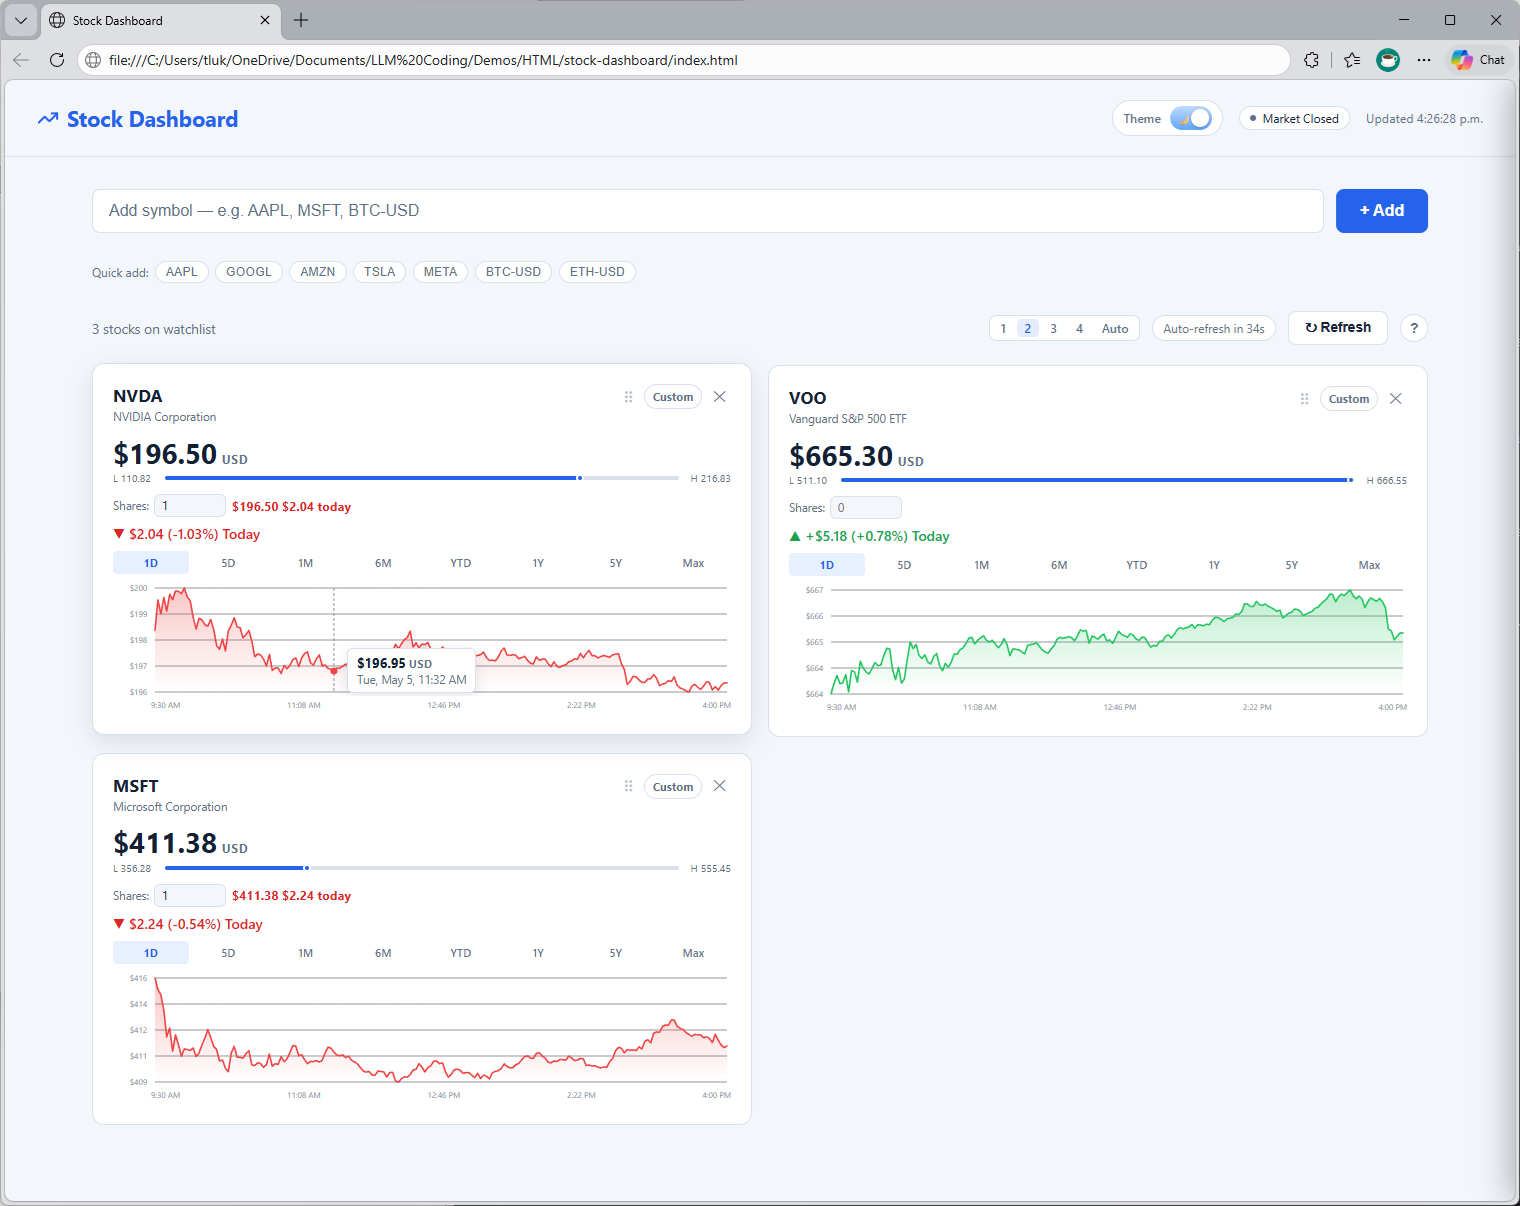
1D,5D,1M,6M,YTD,1Y,5Y, andMax - Custom date range picker — click
Customon any card, pick a start and end date, and apply. The selected window persists. - 52-week high/low bar — a visual bar under the price showing where the stock currently sits between its 52-week low and high, with a blue dot marking the current price
- Shares input with P&L — enter how many shares you hold and the card shows your current position value alongside today’s dollar gain or loss
- Drag-to-reorder — grab the
⠿handle on any card and drag it to rearrange your watchlist - Light and dark theme — toggle between light and dark mode; preference is saved
- Full persistence via localStorage — your watchlist, chart ranges, custom date windows, theme, column layout, and share counts all survive a page refresh
The keyboard shortcuts are minimal but useful: / focuses the search input and R refreshes all cards.
Try It Yourself
Because it’s a single file with no dependencies, running it is as simple as downloading index.html and opening it in any modern browser.
You can grab the code here: https://github.com/terenceluk/stock-dashboard
Or you can preview it here: https://htmlpreview.github.io/?https://github.com/terenceluk/Demos/blob/main/HTML/stock-dashboard/index.html
No Node, no Python, no package install. Just open and go.
One thing worth knowing: the app fetches data through a public CORS proxy to reach Yahoo Finance’s chart and search endpoints. There’s a fallback proxy path built in for reliability, but since it depends on third-party endpoints, availability can vary. For personal, occasional use it works well.
The Tech Stack
This one is intentionally minimal:
| Everything | Single HTML file: HTML + CSS + JavaScript |
| Data | Yahoo Finance chart/search endpoints via CORS proxy |
| Persistence | Browser localStorage |
| Charts | Inline SVG rendered from price data |
No React, no Vite, no build toolchain, no npm. The entire application’s markup, styles, and logic lives in one file that opens cold in under a second. That constraint was a deliberate design choice and also something I specifically asked Copilot to honour from the start.
How I Built This with GitHub Copilot
This followed the same vibe coding approach I used for the travel planner: describe what I want in plain language, review what Copilot generates, and refine from there.
My Approach: Prompt, Review, Refine
Here’s a rough outline of the prompting journey:
1. Start with the constraint, not the feature list
The most important prompt I wrote was the very first one:
“I want a stock dashboard that runs as a single HTML file with no dependencies and no build step. It should fetch market data from Yahoo Finance and show each stock as a card with a sparkline chart. The whole solution’s HTML, CSS, and JavaScript should live in one file.”
Establishing the “single file, no dependencies” constraint upfront meant Copilot never wandered toward suggesting React or a Node backend. It shaped every decision that followed.
2. Build the data layer first
“Fetch OHLCV data from Yahoo Finance for a given ticker and range. Handle CORS by routing through a public proxy. Return price and volume arrays.”
Copilot produced a clean fetchYahooData() function. I reviewed it, asked it to add a fallback proxy, and moved on.
3. Add cards and charts incrementally
Rather than asking for everything at once, I added features one at a time:
- “Render each stock as a card with the current price, daily change, and a sparkline SVG”
- “Add range buttons for 1D, 5D, 1M, 6M, YTD, 1Y, 5Y, Max that reload the chart for that card”
- “Add a 52-week high/low bar with a dot showing where the current price sits”
- “Add a shares input and calculate position value and daily P&L”
- “Add live ticker autocomplete using Yahoo Finance’s search endpoint”
Each prompt was one thing. That rhythm kept the output easy to review and the bugs isolated.
4. Persistence and UX polish
Once the core was working:
- “Save the watchlist, ranges, and custom date windows to localStorage and restore them on load”
- “Add a drag handle to each card for reordering”
- “Add a light/dark theme toggle and persist the preference”
- “Add keyboard shortcuts: / to focus search, R to refresh all cards”
- “Add an inline help panel that lists all keyboard shortcuts and explains each section”
5. Edge cases
The last round of prompting was about resilience:
- “Some tickers may not have intraday data for 1D and for those cases simply fall back gracefully and show a message”
- “Custom date ranges with no trading activity in the window should show a no-data message instead of an empty chart”
- “If the primary CORS proxy fails, retry with a fallback proxy before showing an error”
Tips That Made the Experience Better
- Lead with constraints. “Single file, no dependencies, no build step” set the architectural foundation. If you don’t say it early, Copilot will default to what it sees most often, which is usually a framework with a build pipeline.
- One feature at a time. Asking for everything in one prompt produces output that’s hard to review. Small, sequential prompts let you catch problems before they compound.
- Describe what you see, not what you want to call things. “The card looks a bit cluttered, can you push the 52-week bar below the price block and give it a bit more vertical padding?” gets better results than “refactor the card layout.”
- Ask Copilot to explain data handling choices. Anywhere money or positions were involved, I asked it to walk me through the math. It caught a rounding issue in the P&L calculation I might have missed.
Final Thoughts
The code isn’t production-grade and I’d be the first to say it. It’s a personal tool built quickly for a specific need but that’s exactly the point: vibe coding lets you move from “I want this application” to “wow, this application exists because I wanted it”.