One of the common topics I am asked about Azure is how to best monitor the resources with Azure Monitor. There isn’t really a short answer for his because Azure Monitor encompasses a full suite of components that that collect, analyze, and act on telemetry from cloud and on-premises environments. Barry Luijbregts has a great walkthrough of the when and what when monitoring applications and services in an Azure Fridays video:
What to use for monitoring your applications in Azure | Azure Friday
https://www.youtube.com/watch?v=Zr7LcSr6Ooo
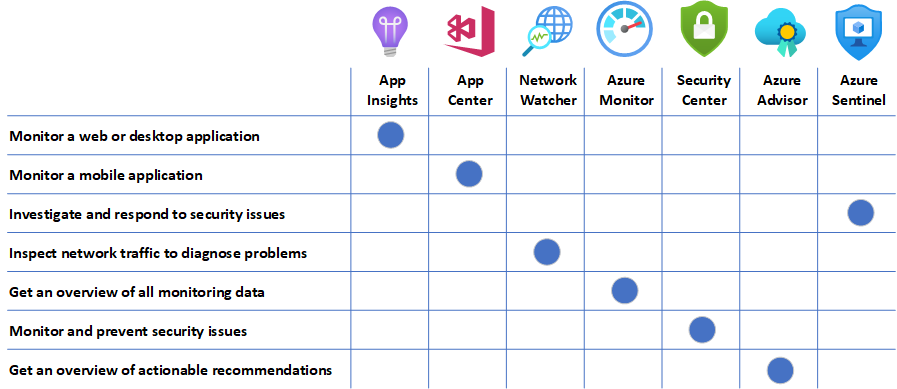
In the video, he provided a matrix of mappings for the monitoring options in Azure and the use case (I recreated the table with newer icons):
I intend on finding time to write a series of blog posts to demonstrate the monitoring options and today I would like to start with how to monitor and alert for an Azure virtual machine with Azure Monitor. The following are the topics I’ll be covering for this blog post.
- Create and configure a Log Analytics Workspace
- Enable Insights for a virtual machine
- Configure Log Analytics to collect logs (Windows event logs, Windows performance counters, Linux performance counters, Syslog and IIS Logs)
- Query Log Analytics with Kusto query language (KQL)
- Setting up an Alert to notify an email address based on the Kusto query
- Monitor Virtual Machine with the Activity Log
Create and configure a Log Analytics Workspace
Before proceeding to enable monitoring on the virtual machines, we’ll should create and configure a Log Analytics Workspace for data ingestion. A single subscription can use any number of workspaces depending on the requirements, you can have multiple virtual machines and resources logging into the same Log Analytics workspace, and the only requirement of the workspace is that it be located in a supported location and be configured with the VMInsights solution. Once the workspace has been configured, you can use any of the available options to install the required agents on virtual machine(s) and virtual machine scale set and specify a workspace for them to send their data. VM insights will collect data from any configured workspace in its subscription.
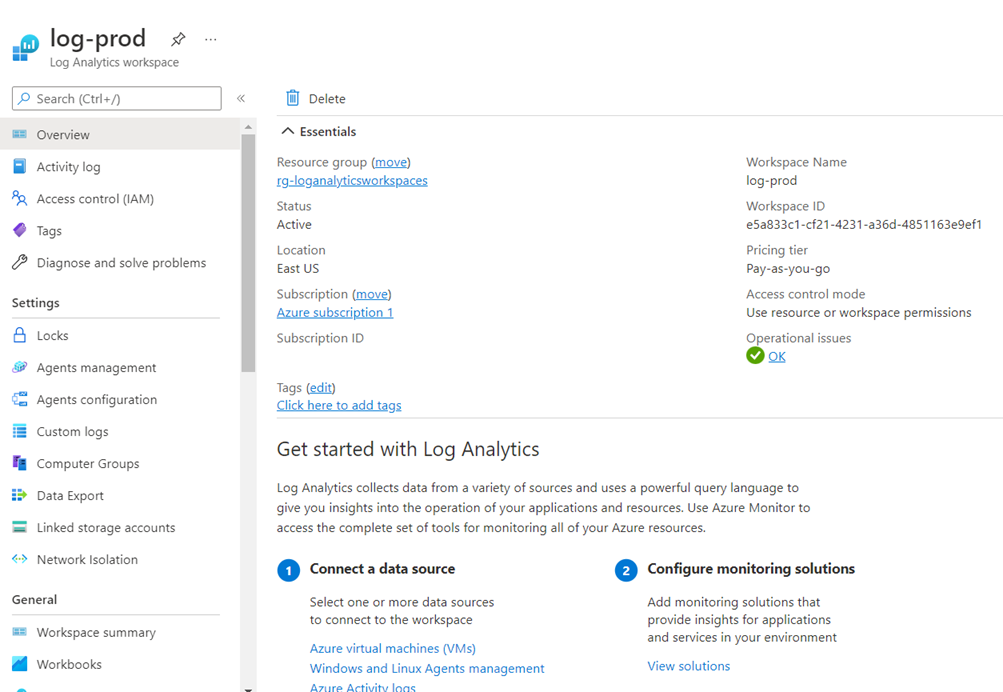
Navigate to the Log Analytics workspaces service in the Azure portal:
Create a new workspace:
We’ll be back here to configure the settings after onboarding the virtual machines.
Enable Monitoring for Virtual Machine
There are several ways to onboard the virtual machines into Azure Monitor and install the required agents on the VMs.
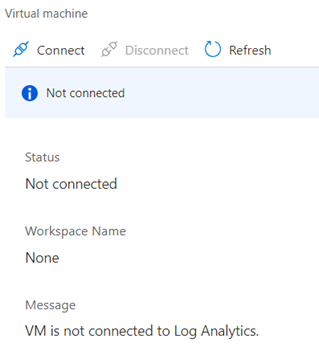
You can navigate to the Virtual machines section in the Log Analytics workspace and connect the virtual machine but this will not enable Insights:
Then click on the Connect button:
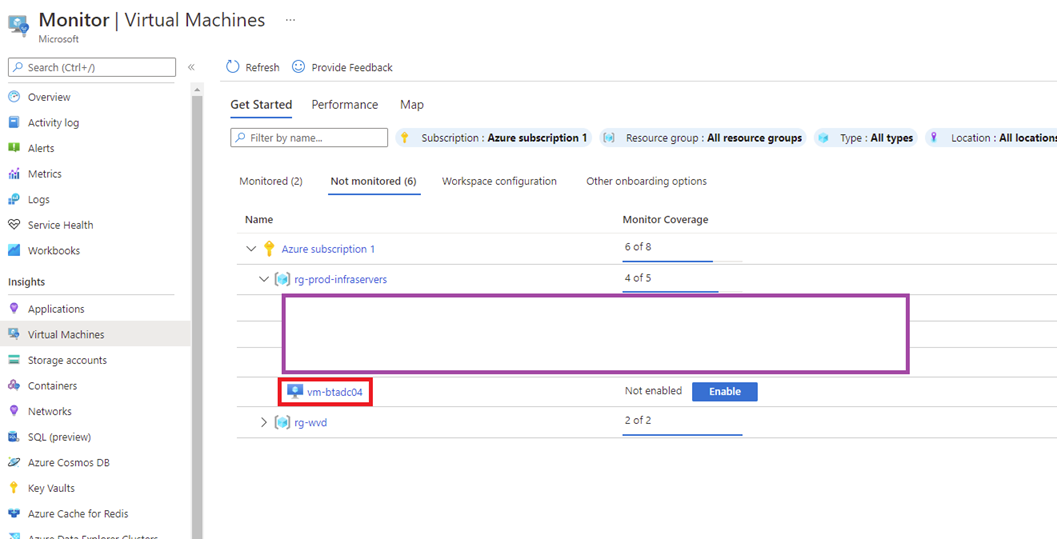
The alternative, which I prefer because it automatically turns on Insights is to navigate into the Monitor service:
Then to Virtual Machines, into the Not monitored tab and either click into the VM or click on the Enable button:
You will be asked to select the Log Analytics Workspace that was created in the previous step or use a default one:
The agent will take a few minutes to install and the following will displayed within the Windows Programs and Features when completed:
See the following documentation for more information about agents and their features: https://docs.microsoft.com/en-us/azure/azure-monitor/agents/agents-overview
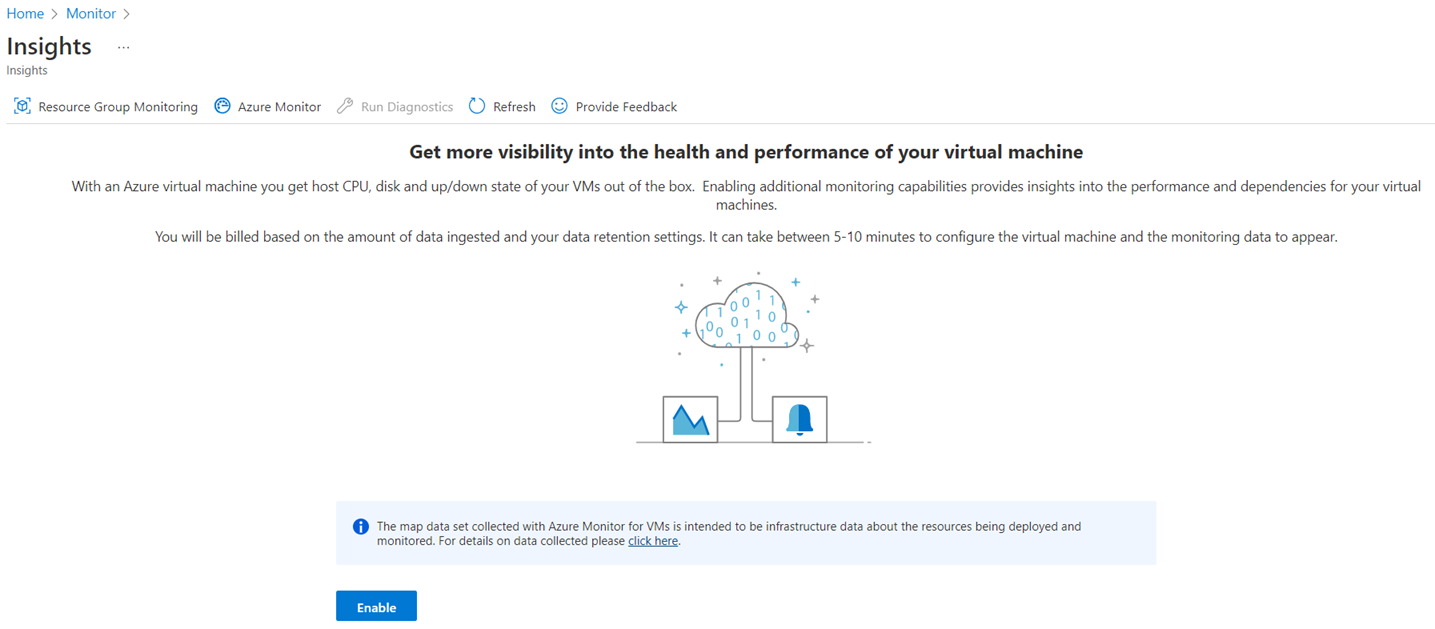
**Note that Dependency Agent will not be installed if the VM was added by connecting to the Log Analytics workspace. To get the Dependency Agent installed, enable Insights by navigating into the virtual machine to the monitored:
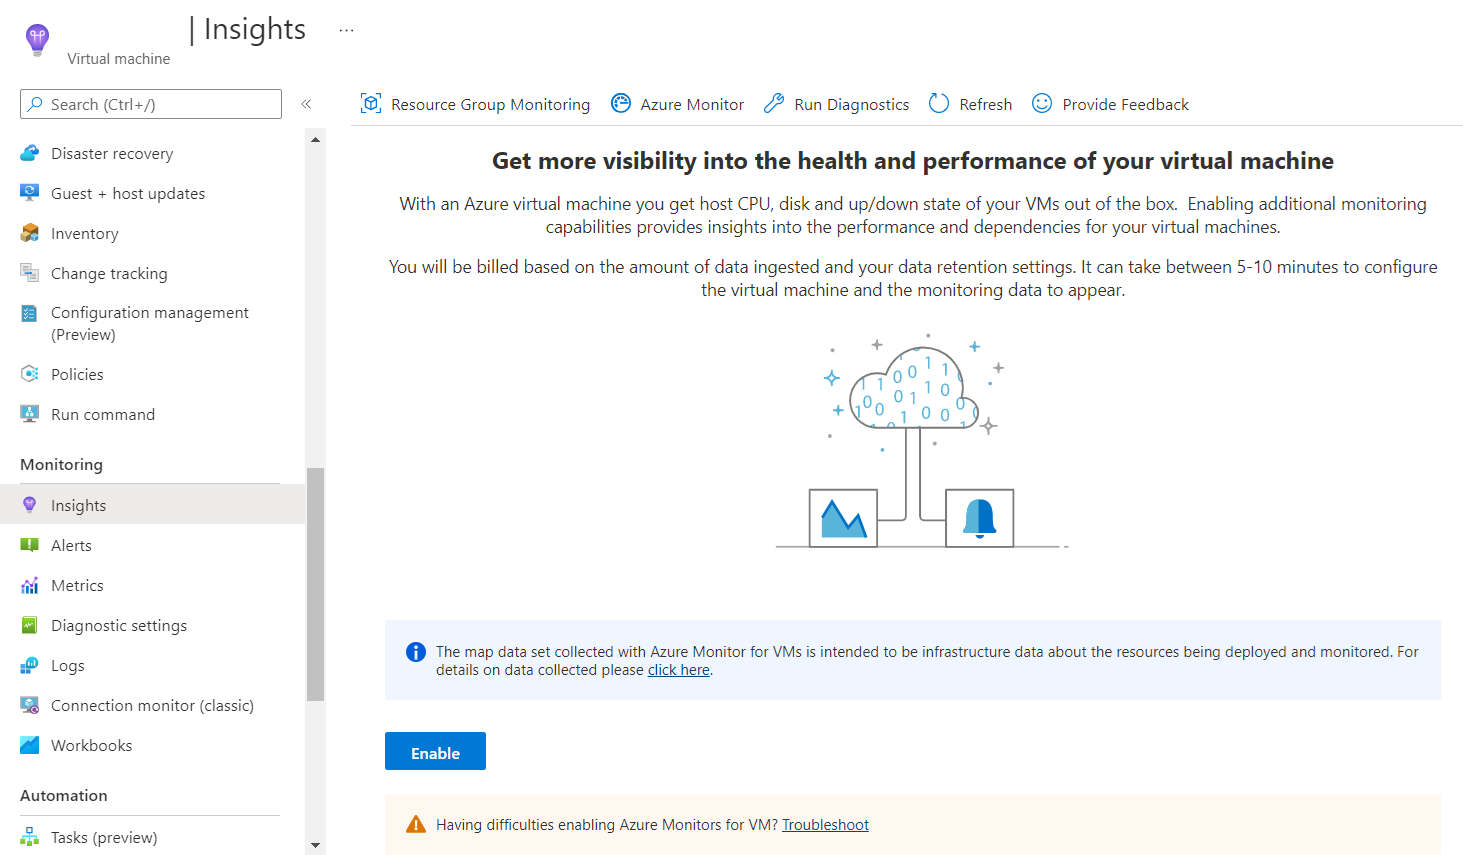
Under Monitoring, click on Insights and then Enable:
Configure Log Analytics to collect logs (Windows event logs, Windows performance counters, Linux performance counters, Syslog and IIS Logs)
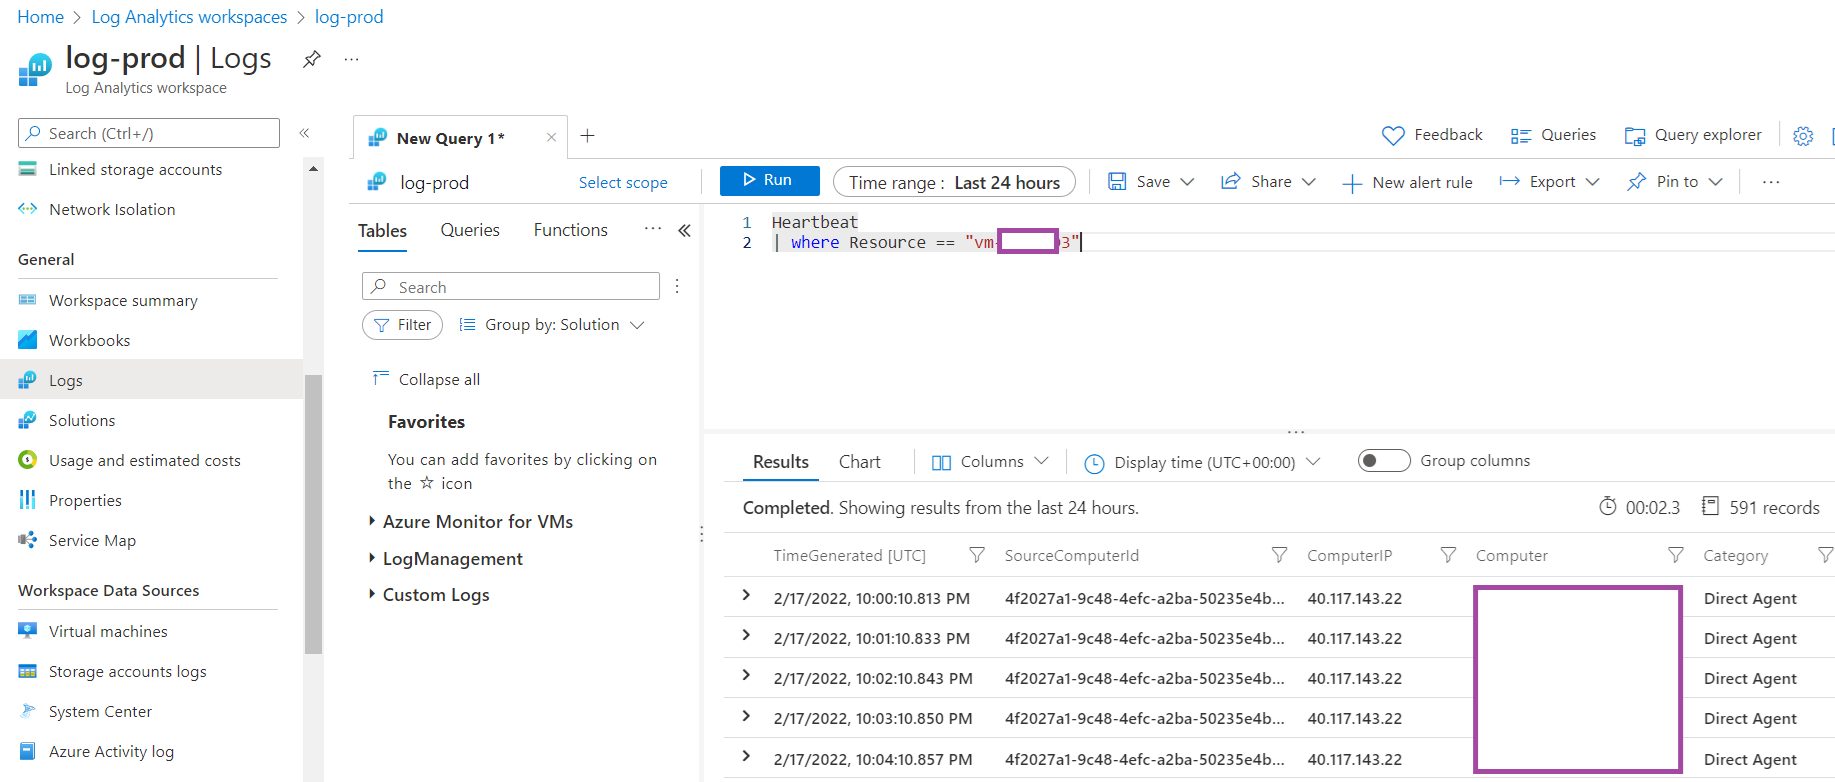
Log Analytics will automatically ingest virtual machine metrics provided by the host but not anything within the operating system. This means that if you load up a query window in the Logs, you can query for heartbeat as such:
Heartbeat
| where Resource == “<vmname>”
**Note that we’re using resource for the query rather than computer as the latter is the FQDN of the Windows virtual machine.
But you won’t be able to query for any information in, say, the event logs of the Windows operating system.
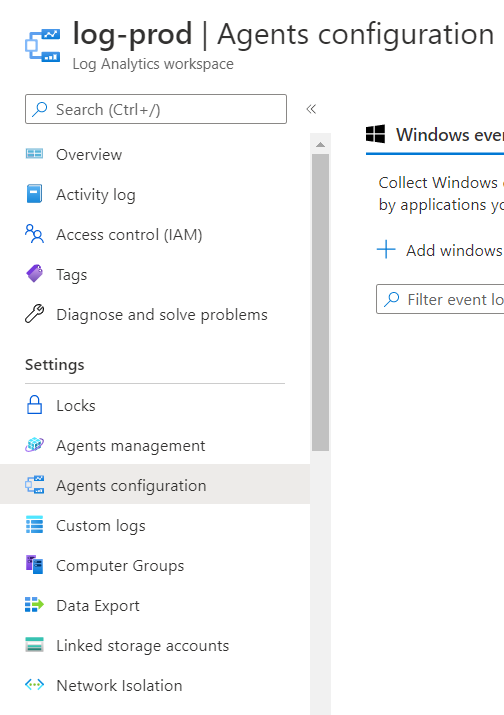
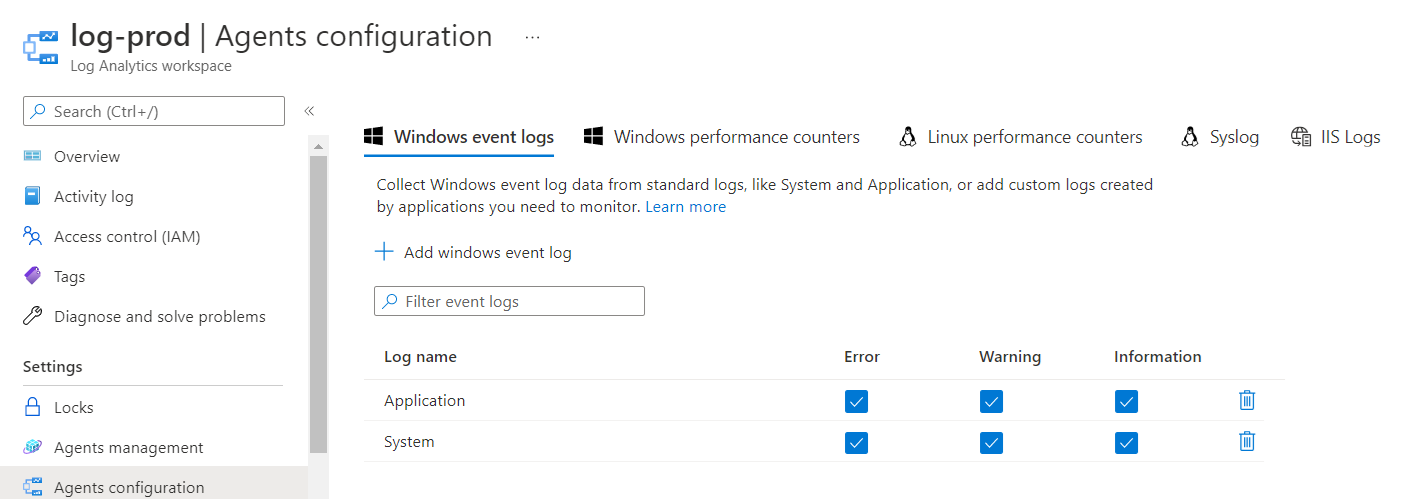
In order to be able to query the event logs, you’ll need to navigate to the Settings section then into the Agents configuration:
You’ll be able to add Windows event logs, Windows performance counters, Linux performance counters, Syslog and IIS Logs. For the purpose of this example, we’ll add the Application and System logs for Windows but remember to add other logs (e.g. Performance) or attempting to query for them will yield no results:
Query Log Analytics with Kusto query language (KQL)
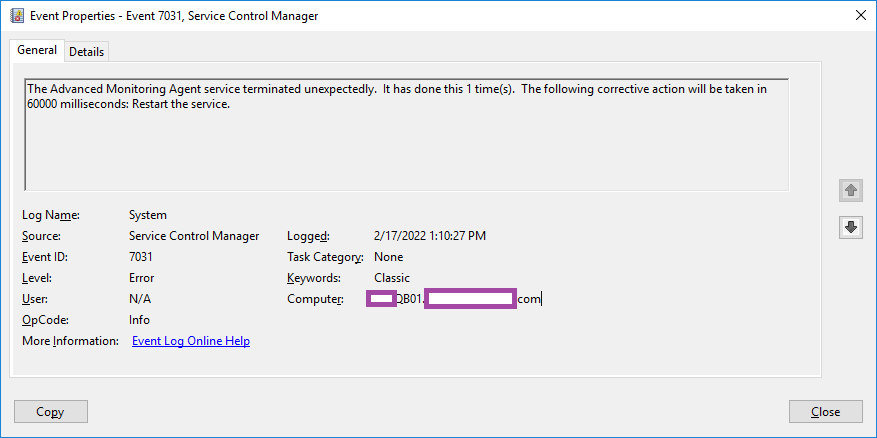
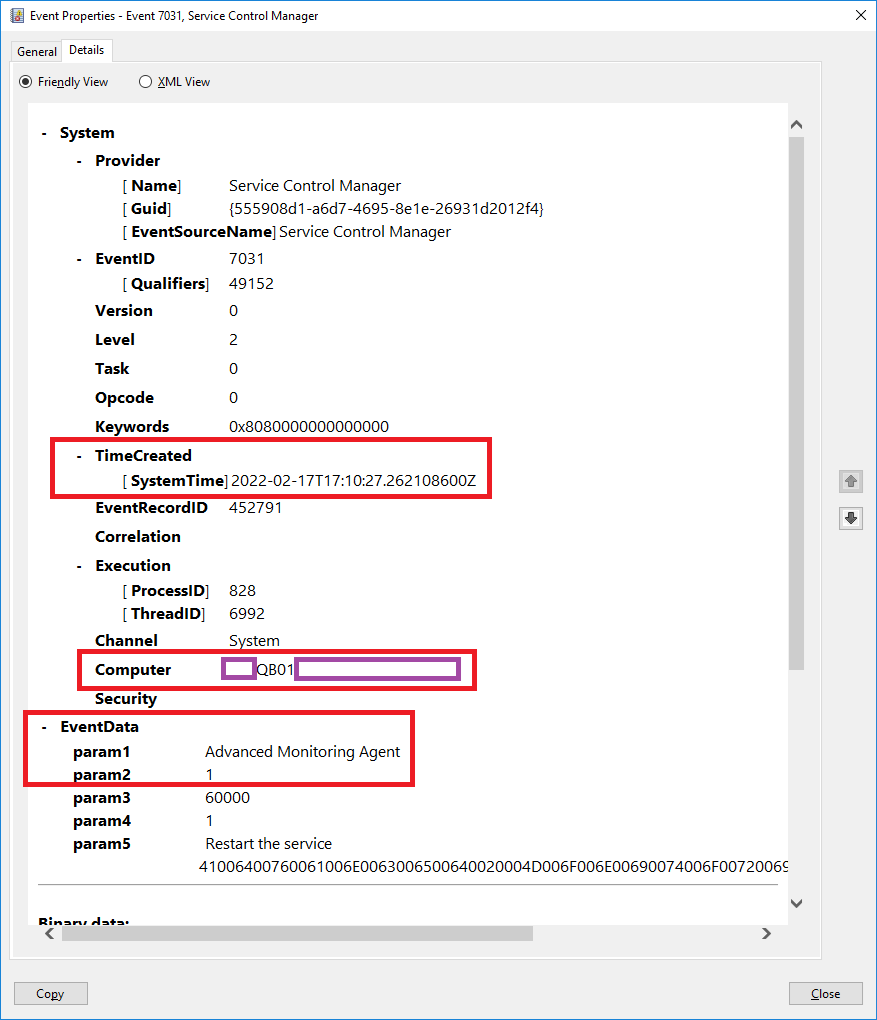
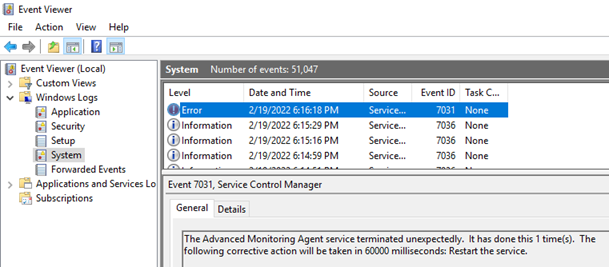
With Log Analytics configured and Windows Event Logs collected, we can now test querying for the data captured. There are plenty of Kusto query blog posts available so I won’t go into the details of syntax or a large variety of queries. For the purpose of this example, we’re going to query for a specific event in the system logs that is written when a service named Advanced Monitoring Agent is abruptly terminated as shown in the following screenshot:
The Advanced Monitoring Agent service terminated unexpectedly. It has done this 1 time(s). The following corrective action will be taken in 60000 milliseconds: Restart the service.
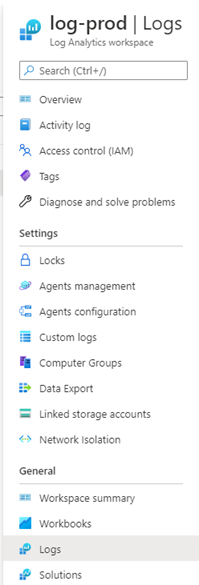
To query for this event in Log Analytics, navigate into the Log Analytics workspace for the virtual machine, scroll to the General heading and navigate to Logs:
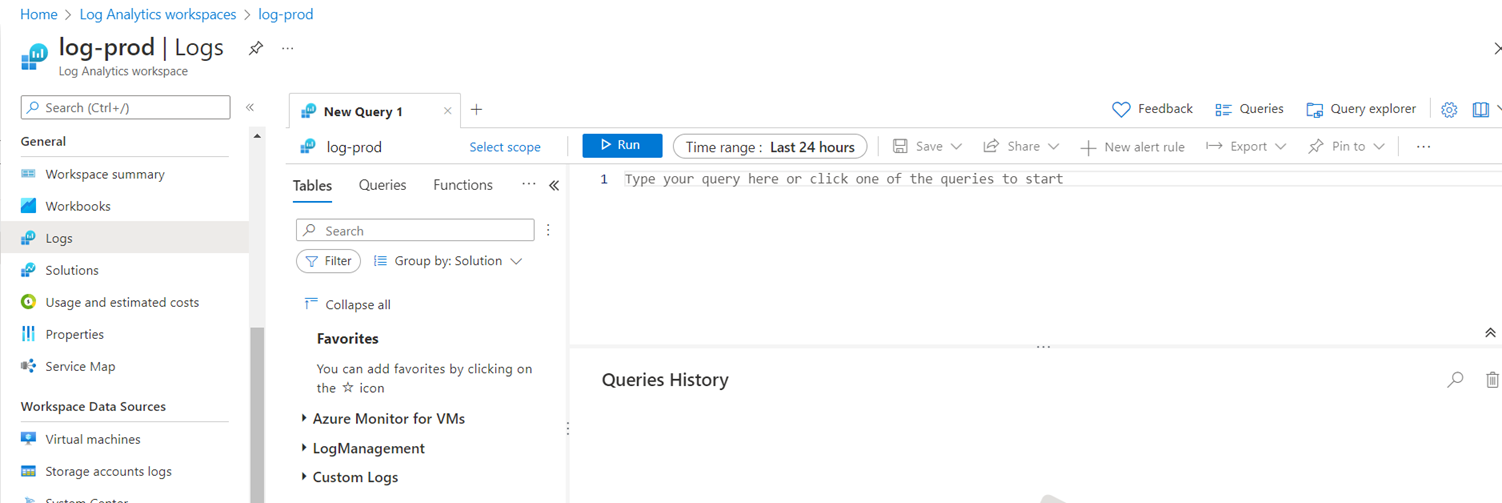
A new empty query window will be displayed:
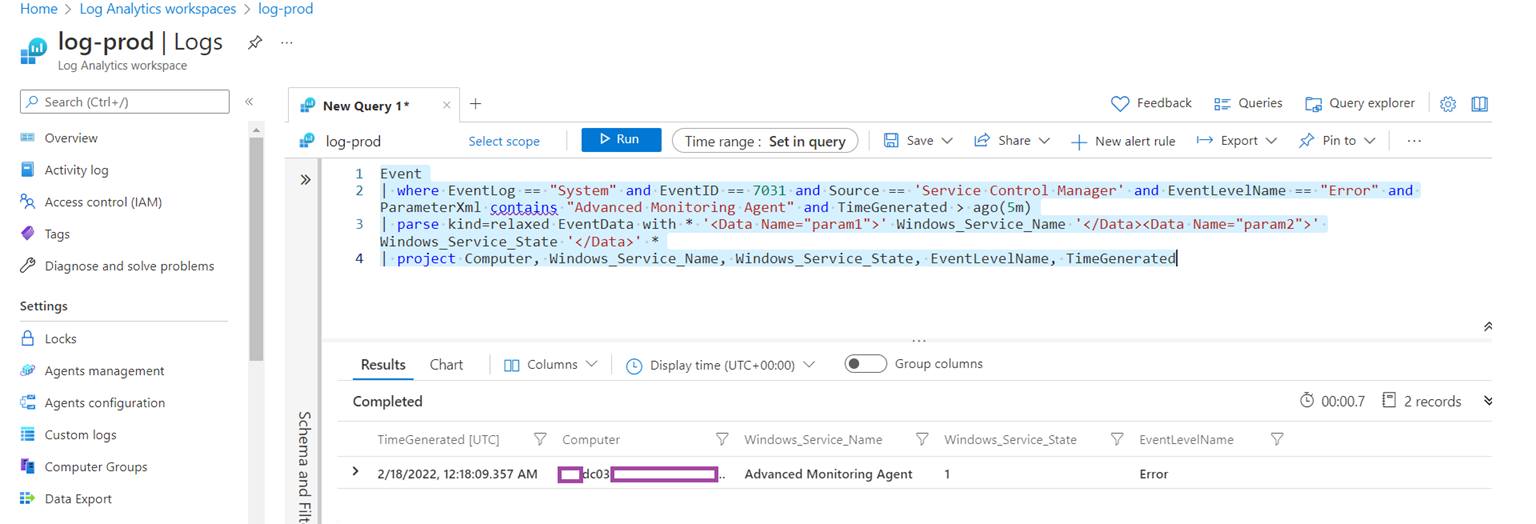
The query we’ll execute is the following:
Event
| where EventLog == “System” and EventID == 7031 and Source == ‘Service Control Manager’ and EventLevelName == “Error” and ParameterXml contains “Advanced Monitoring Agent” and TimeGenerated > ago(5m)
| parse kind=relaxed EventData with * ‘<Data Name=”param1″>’ Windows_Service_Name ‘</Data><Data Name=”param2″>’ Windows_Service_State ‘</Data>’ *
| project Computer, Windows_Service_Name, Windows_Service_State, EventLevelName, TimeGenerated
The query’s requirements (where line) are as follow.
Event needs to have all of these properties:
- Event log is from System
- The Event ID is 7031
- The Source of the event is Service Control Manager
- The Event is an error
- The field containing the service name needs to contain Advanced Monitoring Agent (this field contains more than the name)
- The TimeGenerated must be within minutes (we are comparing the timestamp of the event with the timestamp derived by subtracting 5 minutes from the time now)
**Note that I only have one virtual machine configured for this Log Analytics workspace but most will likely have more than one computer so the following additional where should be included so only the intended VM is returned:
and Computer == ‘computerName.contoso.com’
The purpose of the parse line is to retrieve the values between the param1 and param2 tag, name them with Windows_Service_Name and Windows_Service_State so they can be used in the following project line.
The purpose of the project line is to display the following 5 fields when the record is expanded:
- Computer
- Windows_Service_Name
- Windows_Service_State (1 is stopped)
- EventLevelName
- TimeGenerated (UTC)
The following are the fields mappings found in the event details tab:
Setting up an Alert based on the Kusto query
Setup an Action Group
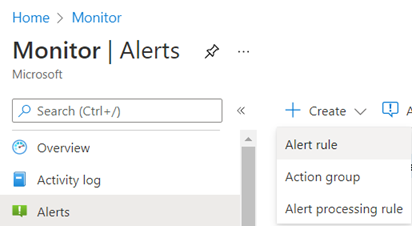
Before we can set up an alert, we’ll need to set up an Action Group, which will be associated to the an Alert Rule. Navigate to Monitor > Alerts > Create > Action Group:
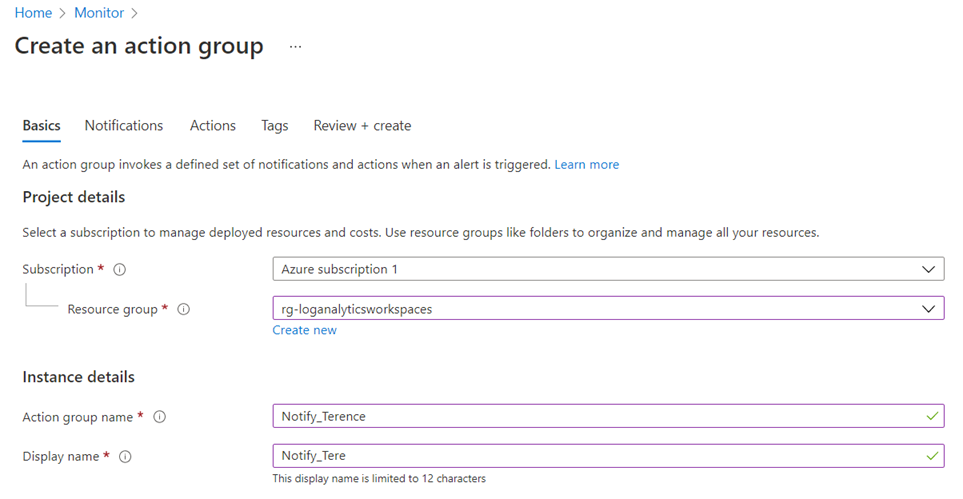
Fill in the appropriate fields for the action group and click on Notifications:
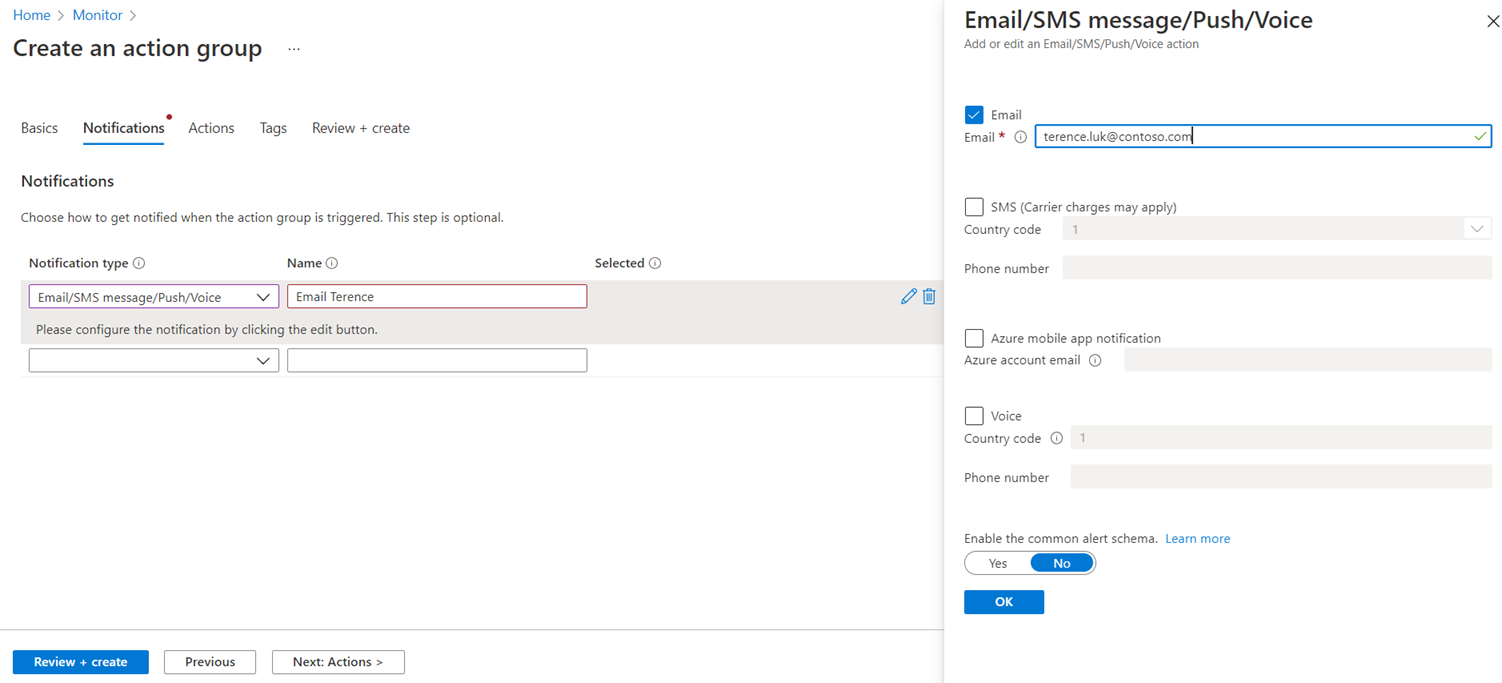
We will be configuring an email notification for this action group so select:
Notification type: Email/SMS message/Push/Voice
Name: A name for the notification type
Email: The email address for the user or group to notify
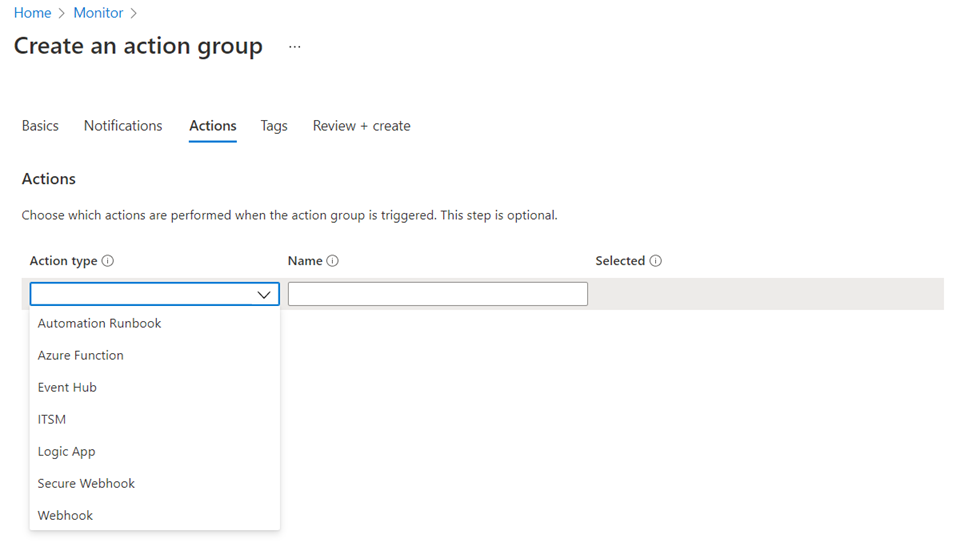
We will be creating an action in a separate post but the Actions tab is where we can specify an action to execute. There are quite a few actions available so the only limitation is your creativity:
- Automation Runbook
- Azure Function
- Event Hub
- ITSM
- Logic App
- Secure Webhook
- Webhook
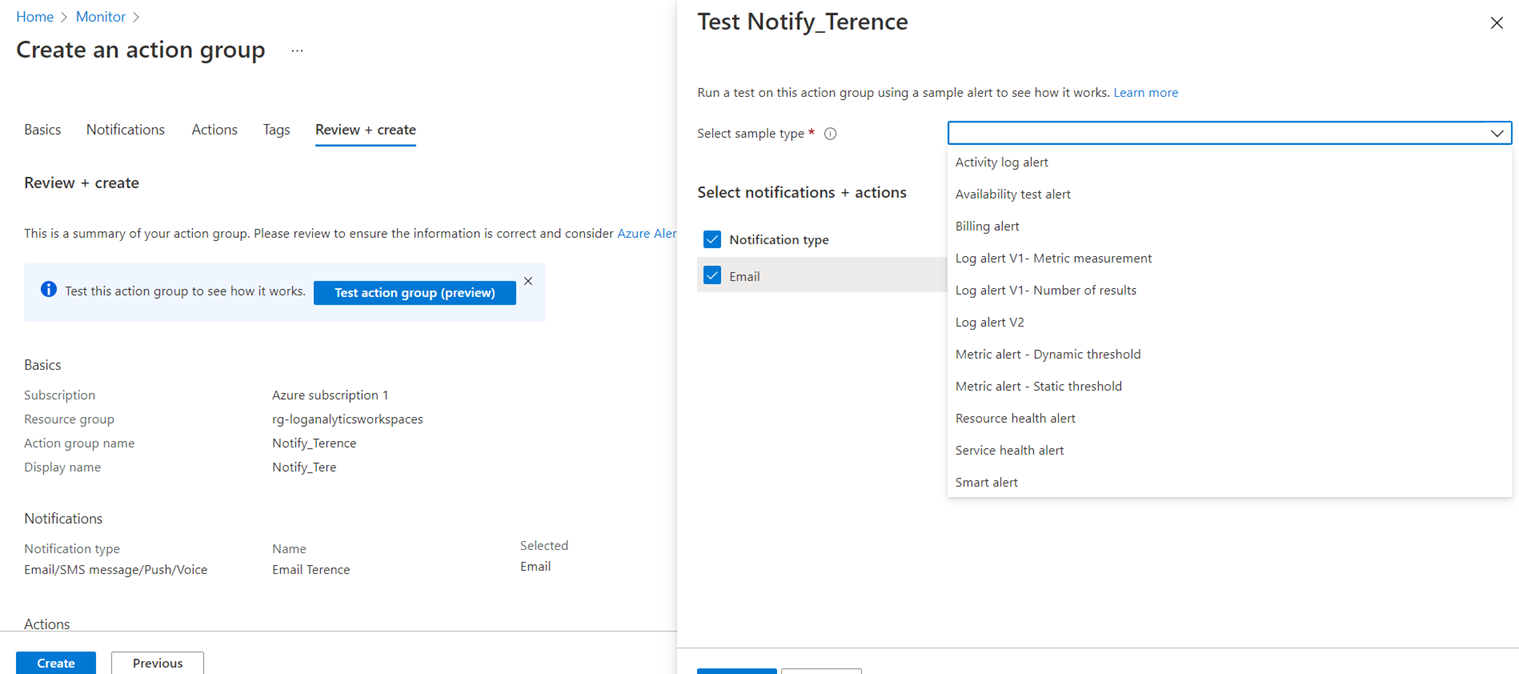
Navigate to the Review + create tab to review the action group and use the Test action group (preview) feature to test the alerting. Note that it doesn’t matter what sample type is selected for the test as anyone of them would send an email:
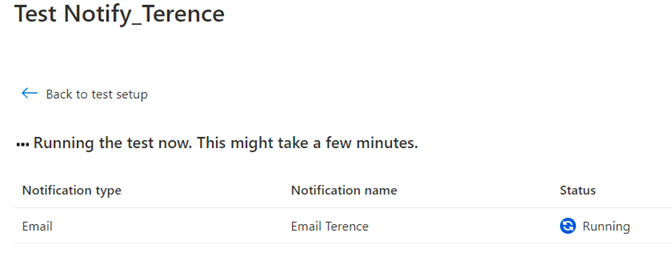
Proceed with the test:
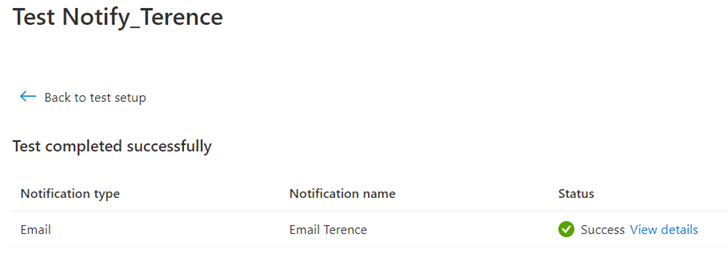
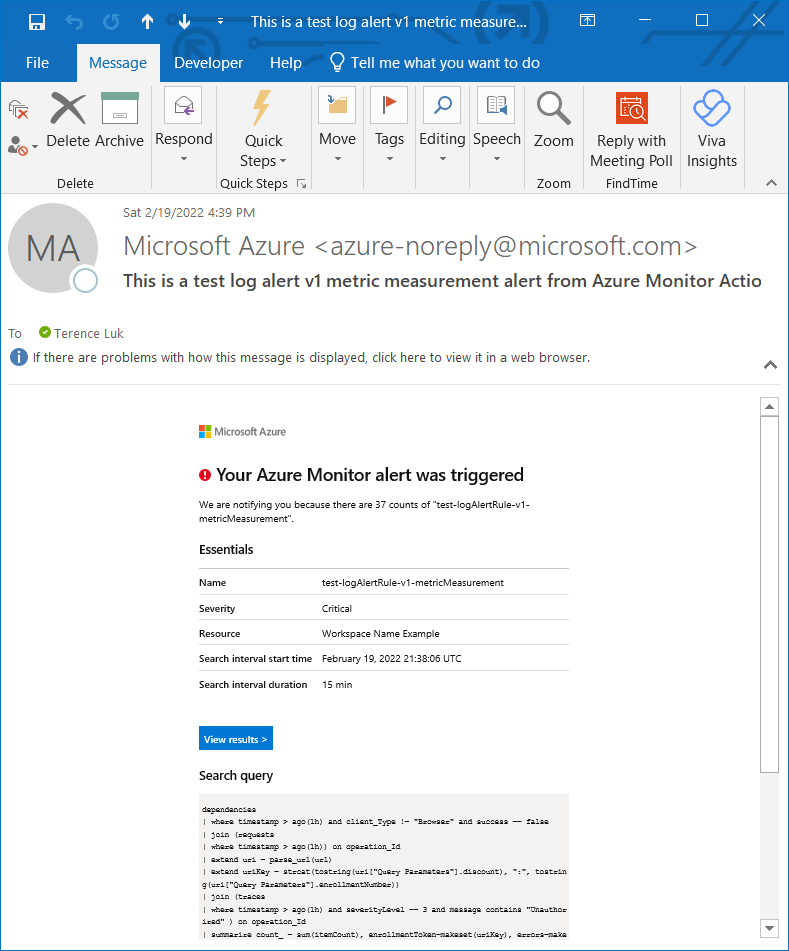
The test should complete and a test email should come in shortly:
Complete creating the Action Group and it should show up in a minute or two:
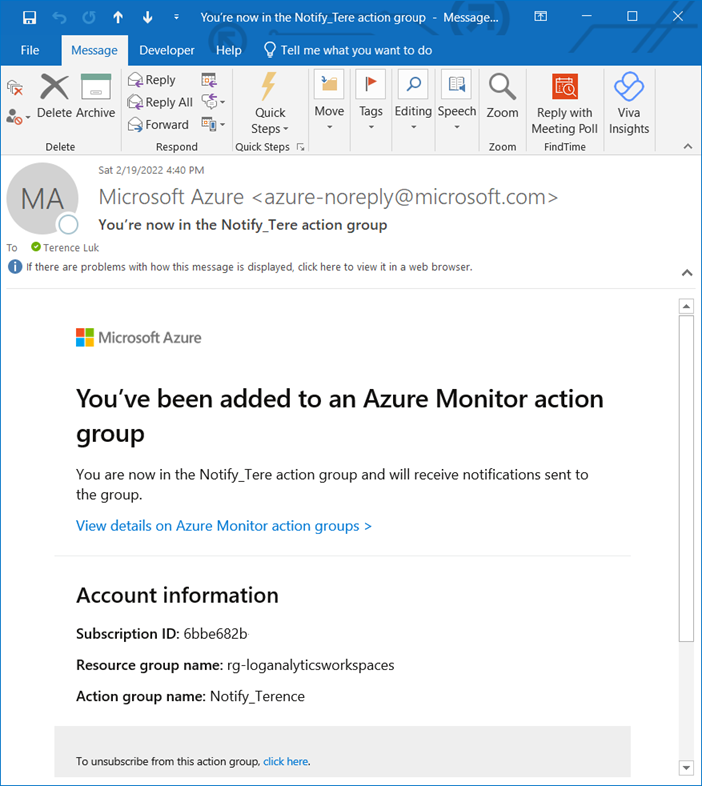
An email should also be sent to the email address configured indicating it has been added to an Action Group:
Setup an Alert Rule
With the Action Group created, we can now proceed to create the alert. There are several ways to create the Alert Rule and depending on where it is initiated, additional options would be required.
Option #1 – Azure Monitor Level
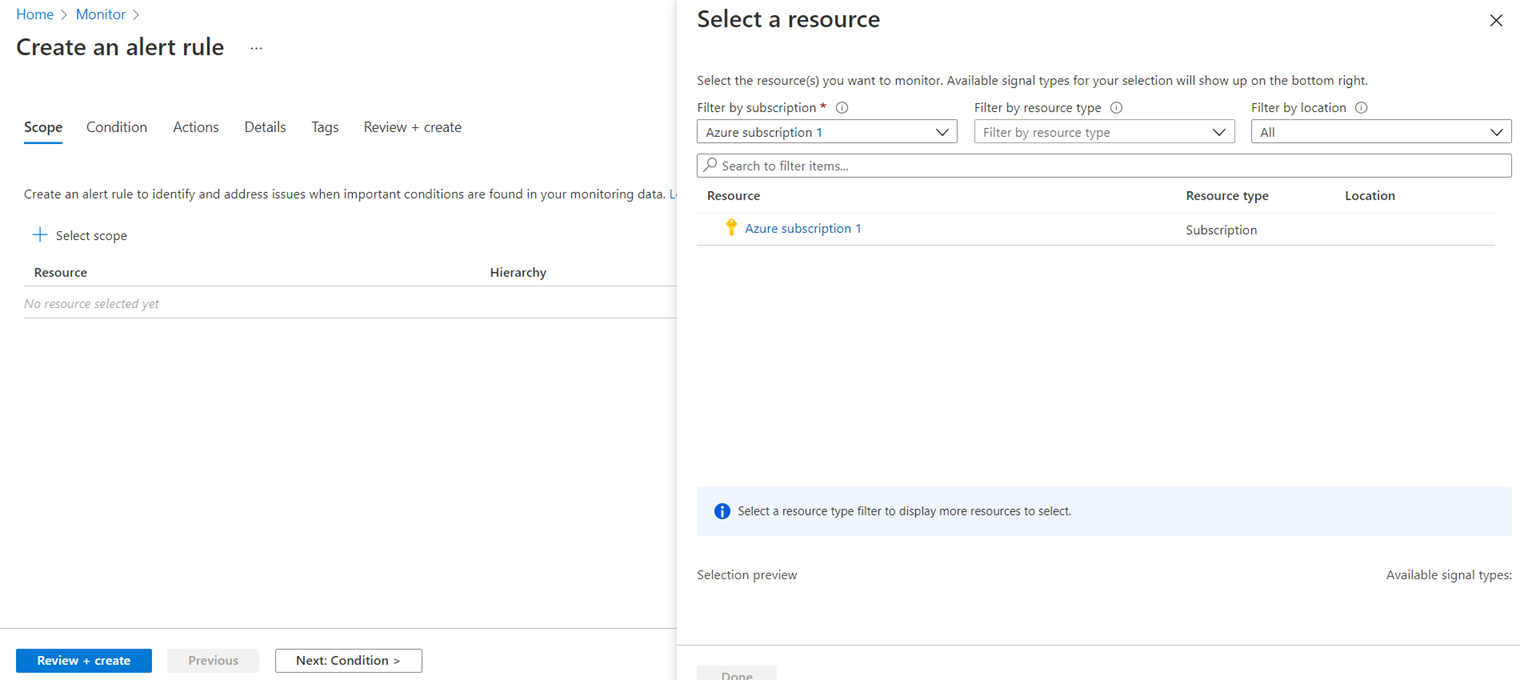
If you create the Alert Rule at the Azure Monitor level via Monitor > Alerts > Create > Alert Rule then you’ll be asked to select the scope at the subscription level:
Option #2 – Log Analytics Level
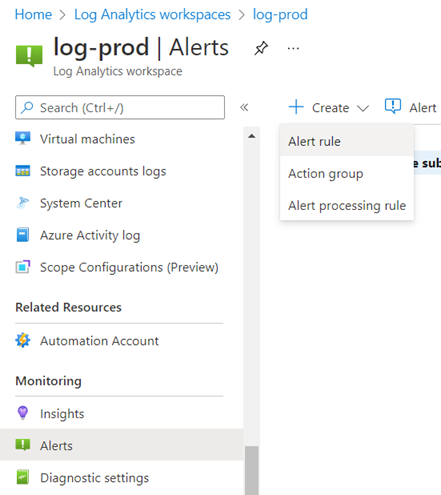
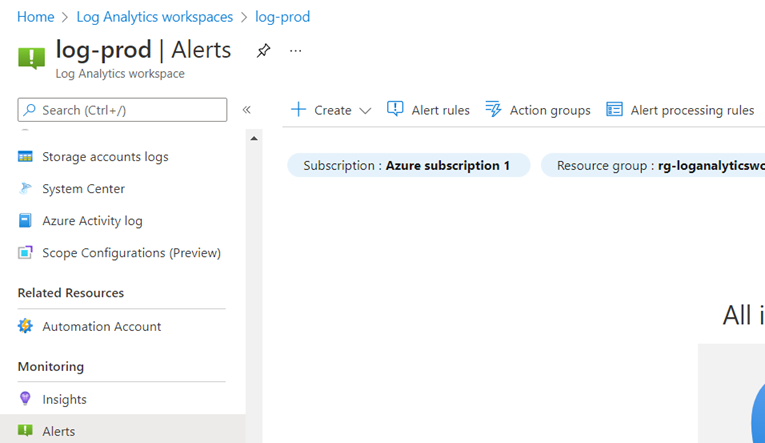
If you already know which Log Analytics Workspace this alert rule is going to be created, you can navigate directly into the Log Analytics Workspace via Log Analytics Workspaces > TheLogAnalyticsWorkspace > Alerts > Create > Alert Rule:
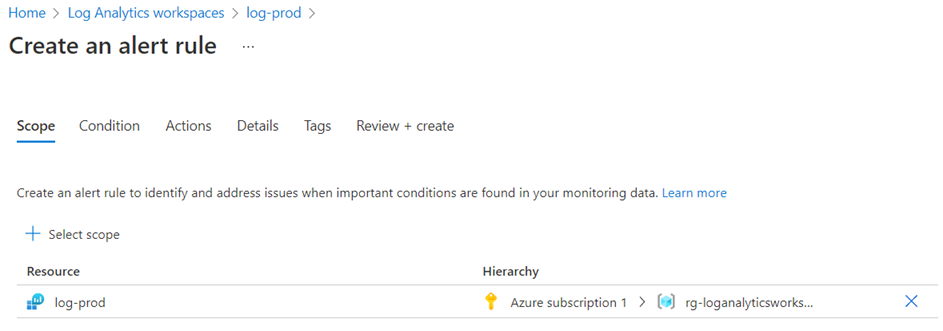
Note that the tab displayed is Condition as the Scope is already filled out:
You can navigate to the Scope tab and see the defined settings prepopulated with the Log Analytics Workspace:
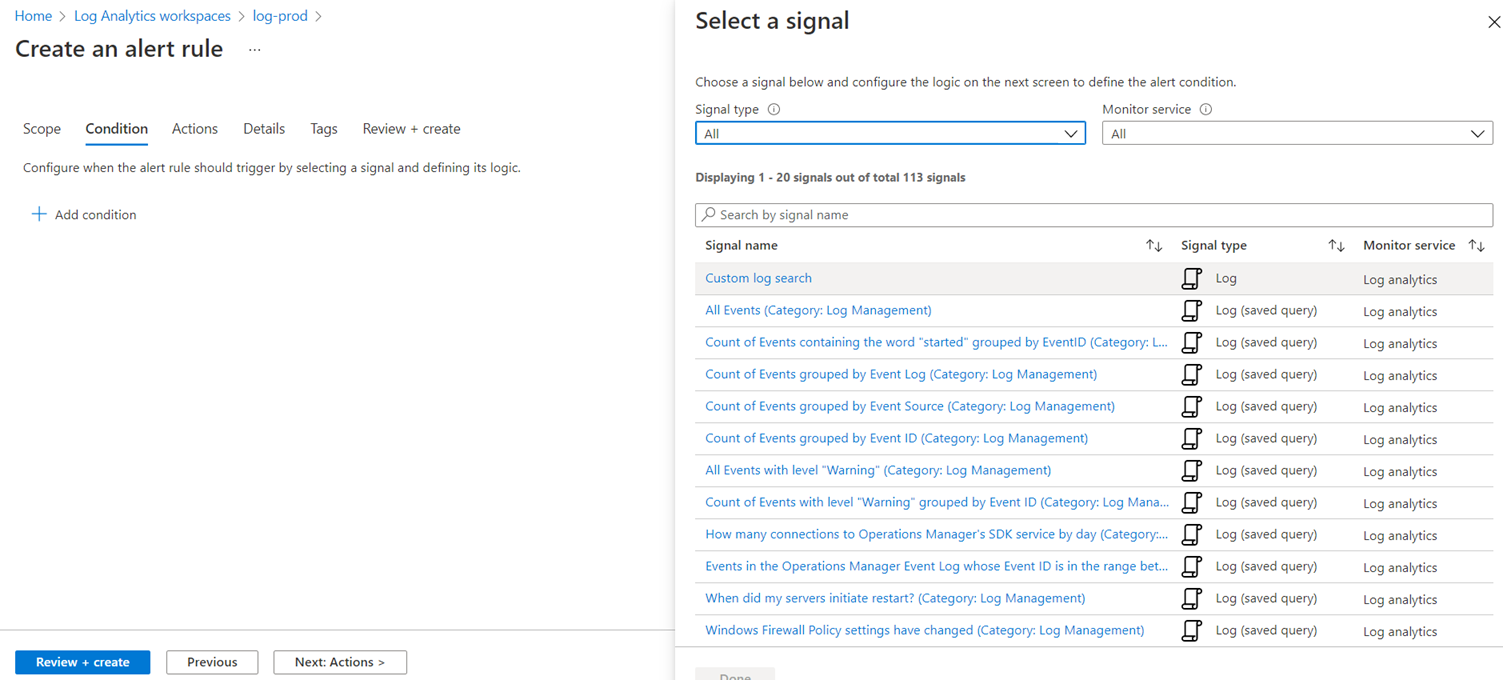
For the purpose of this example, we’ll be using a custom Kusto query so select Custom log search:
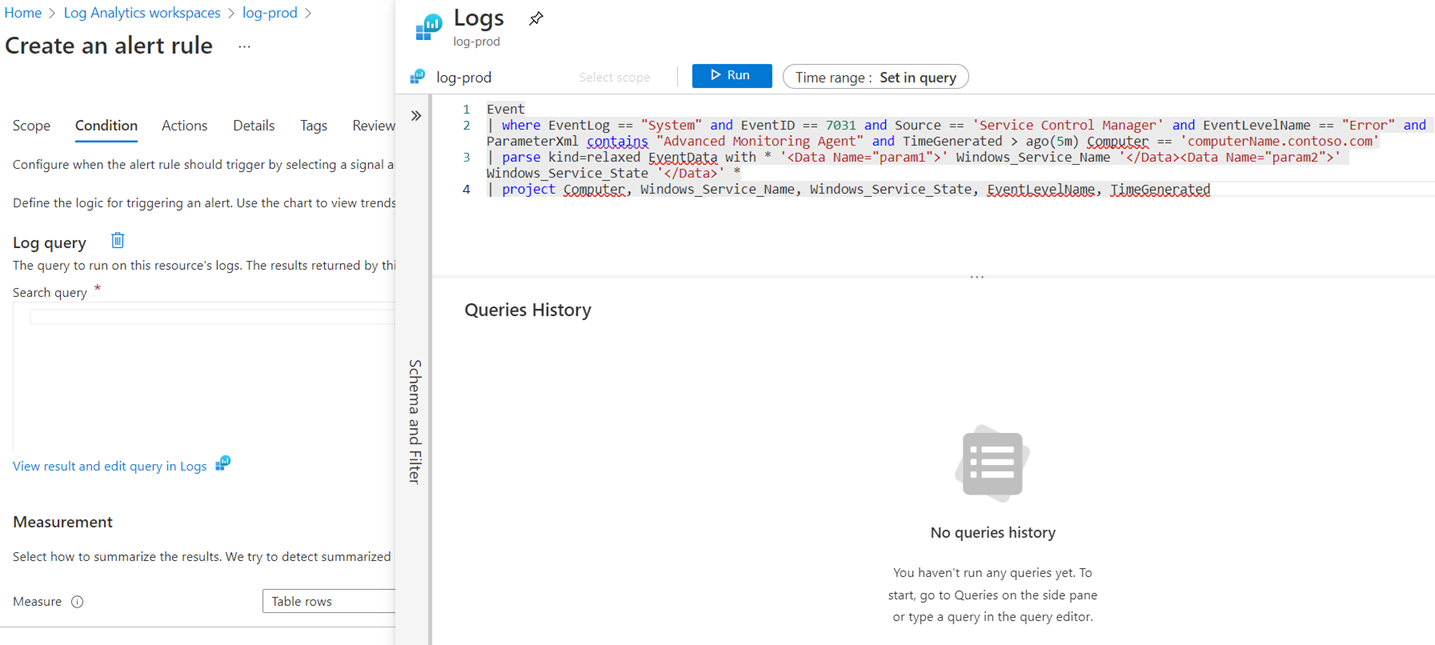
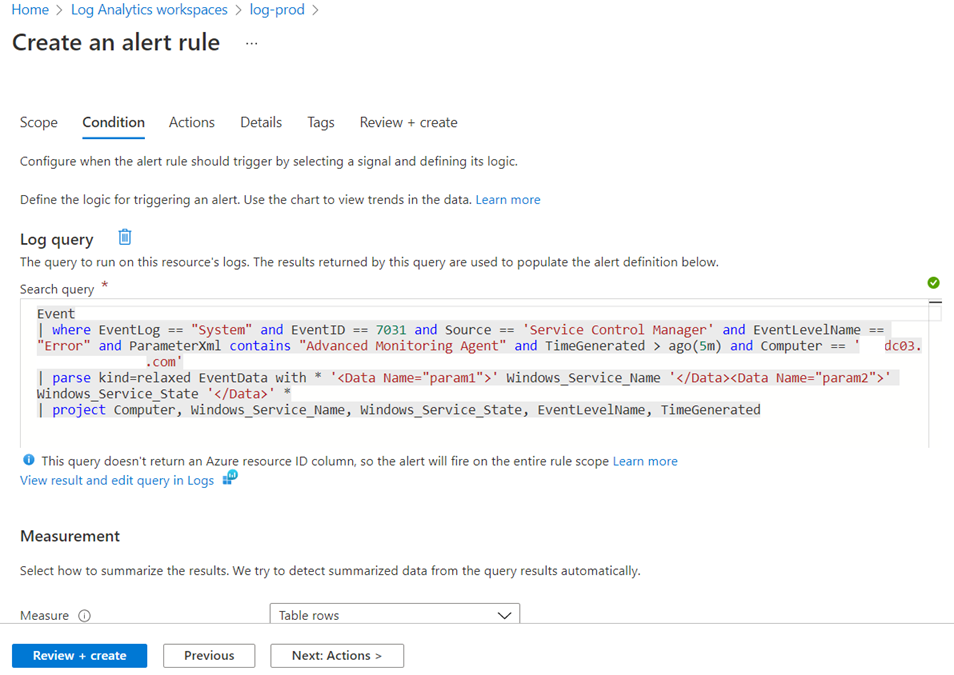
The log query window will be displayed and for the purpose of this example, I’ll be using the same query demonstrated above:
Event
| where EventLog == “System”
and EventID == 7031
and Source == ‘Service Control Manager’
and EventLevelName == “Error”
and ParameterXml contains “Advanced Monitoring Agent”
and TimeGenerated > ago(5m)
and Computer == ‘computerName.contoso.com’
| parse kind=relaxed EventData with * ‘<Data Name=”param1″>’ Windows_Service_Name ‘</Data><Data Name=”param2″>’ Windows_Service_State ‘</Data>’ *
| project
Computer,
Windows_Service_Name,
Windows_Service_State,
EventLevelName,
TimeGenerated
Proceed to execute the query to validate it with the Run button:
Click on the Continue Editing Alert to close the validated query:
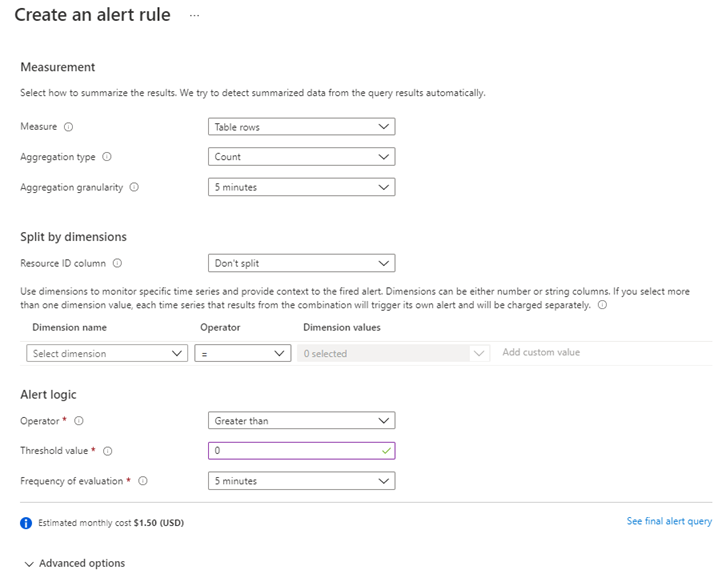
The Condition options will be displayed:
Whether to use the Measurement and Split by dimensions are dependent what we are querying, but for this example, we’re only going to configure the Alert logic to:
Operator: Greater than
Threshold value: 0
Frequency of evaluation: 5 minutes
Our query is supposed to return any unexpected service terminations that are within 5 minutes:
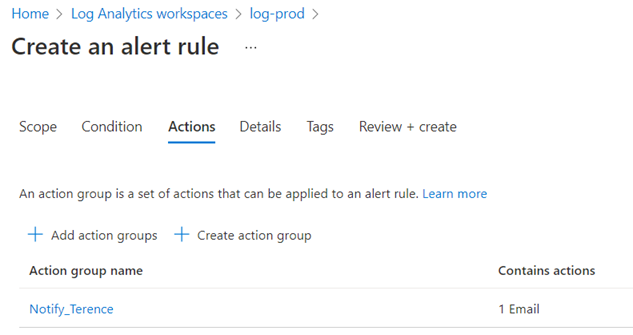
Navigate to the Actions tab and select the previously created Action Group:
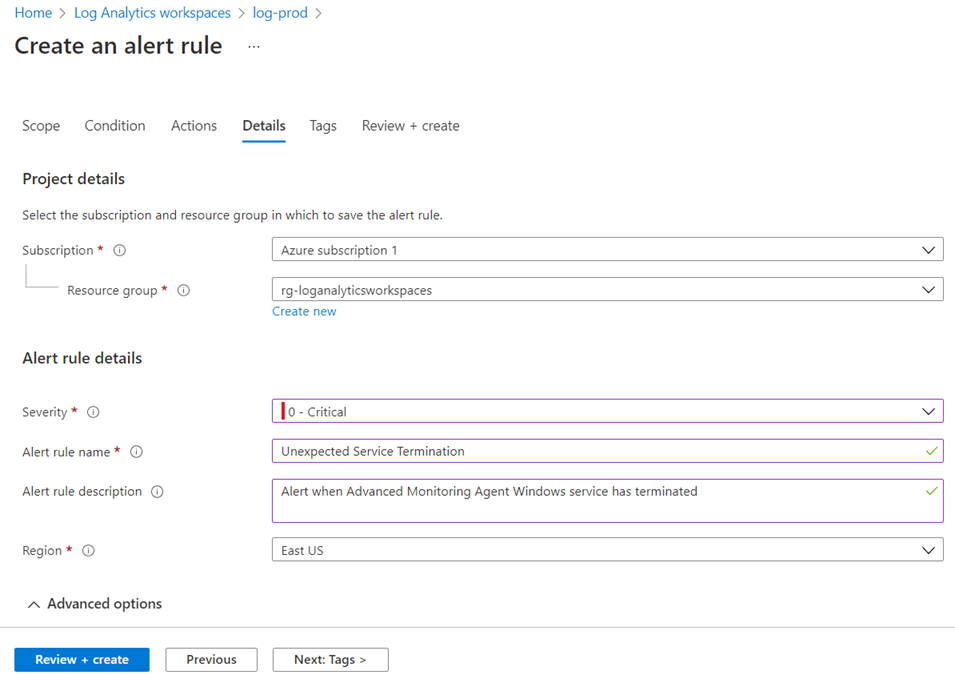
Select the Details tab and fill in the fields as required:
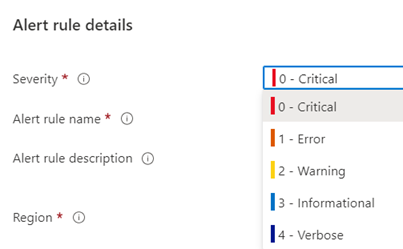
We’ll be configure this as a critical severity:
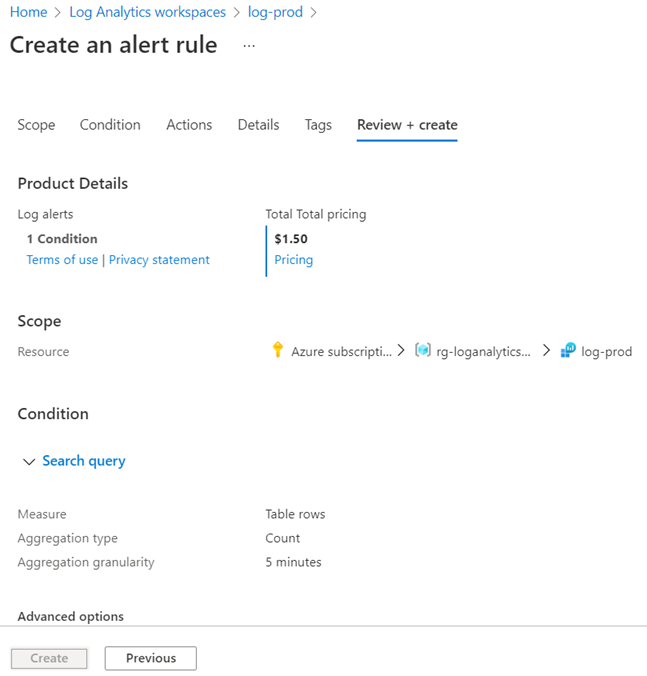
Proceed to create the rule:
Once created, navigate to Alert rules to view the newly created rule:
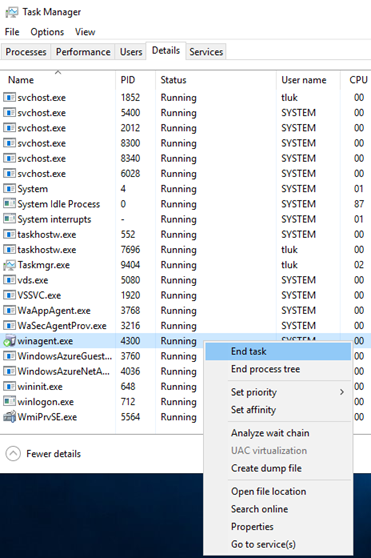
With the rule creation confirmed, proceed to test. I’ll be terminating the service as such:
The following event ID 7031 should be logged:
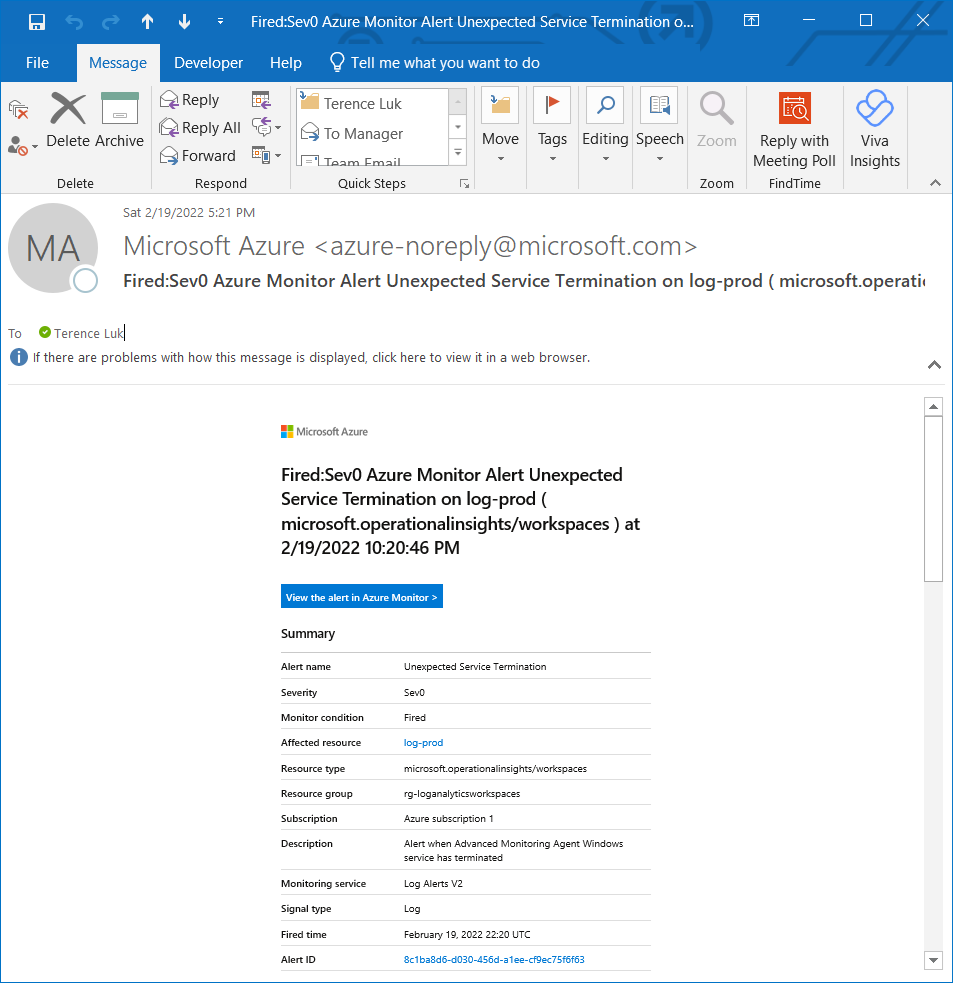
You should receive an alert within a few minutes:
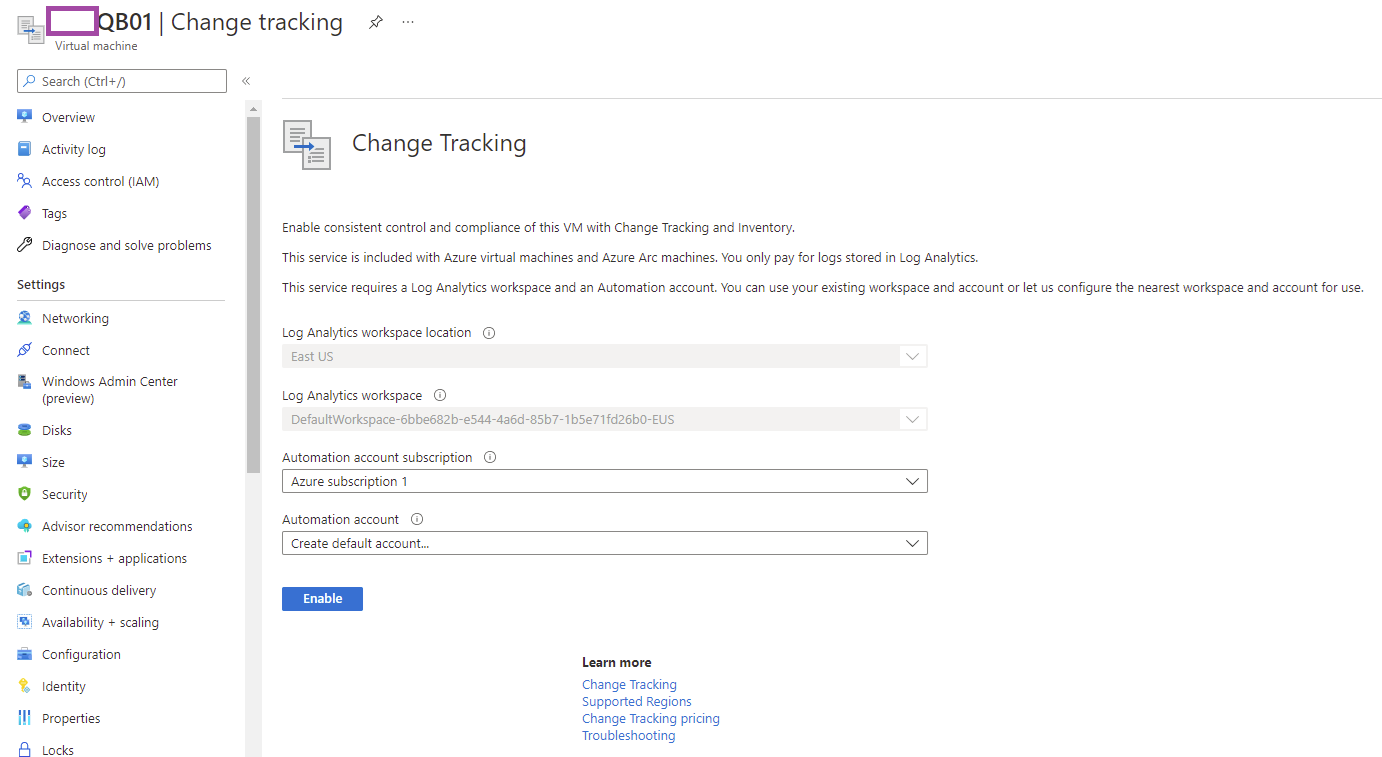
And this is how you would monitor a Windows VM with Log Analytics. One of the potential challenges for using event logs to monitor Windows Services is that you need to know exactly the log you’re looking for. Another method for monitoring Windows services, which I feel is more efficient, is to use Change Tracking and Inventory: https://docs.microsoft.com/en-us/azure/automation/change-tracking/overview which I will demonstrate in another post.
Monitor Virtual Machine with the Activity Log
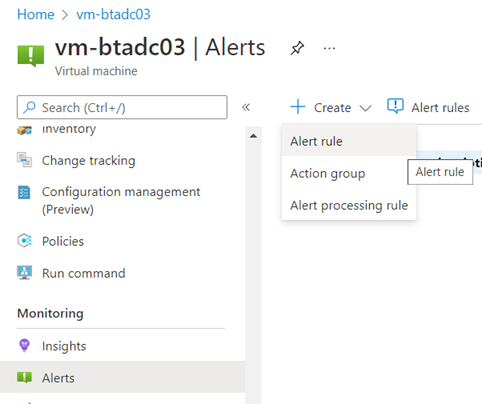
Having gone through using Log Analytics to create a custom query to determine the health of a virtual machine, I’d like to provide another method where instead of using the Signal type of a Log, we can use the Activity Log instead to trigger an alert. Recall that when we create an alert via Virtual Machine > Alerts > Create > Alert rule:
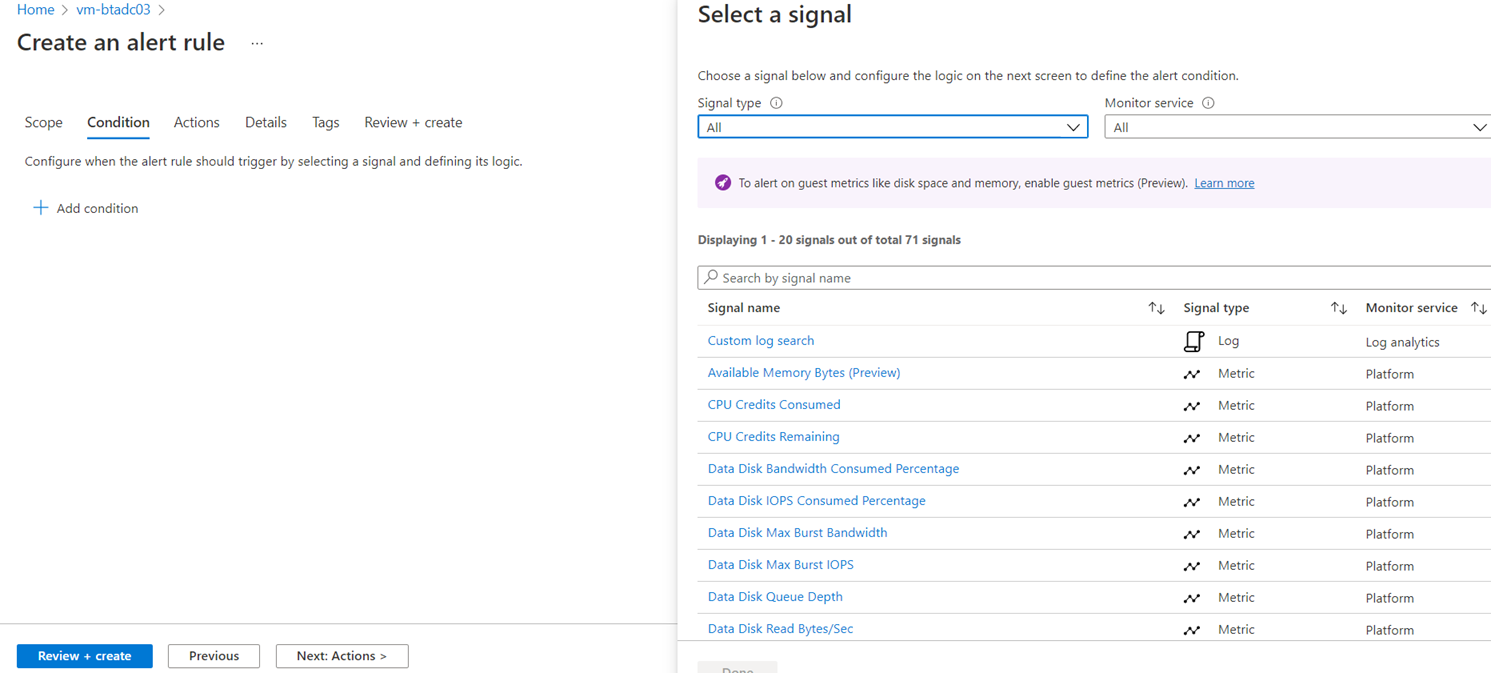
We are presented with the Condition configuration where we select a signal. The signal is essentially the incoming information source that triggers alert. Other than the Custom log search, which we used previously to provide a custom Kusto query, there are also the options:
Metric – Virtual metrics that the platform / hypervisor collects
Activity Log – The log entries entered into the Activity Log of the virtual machine
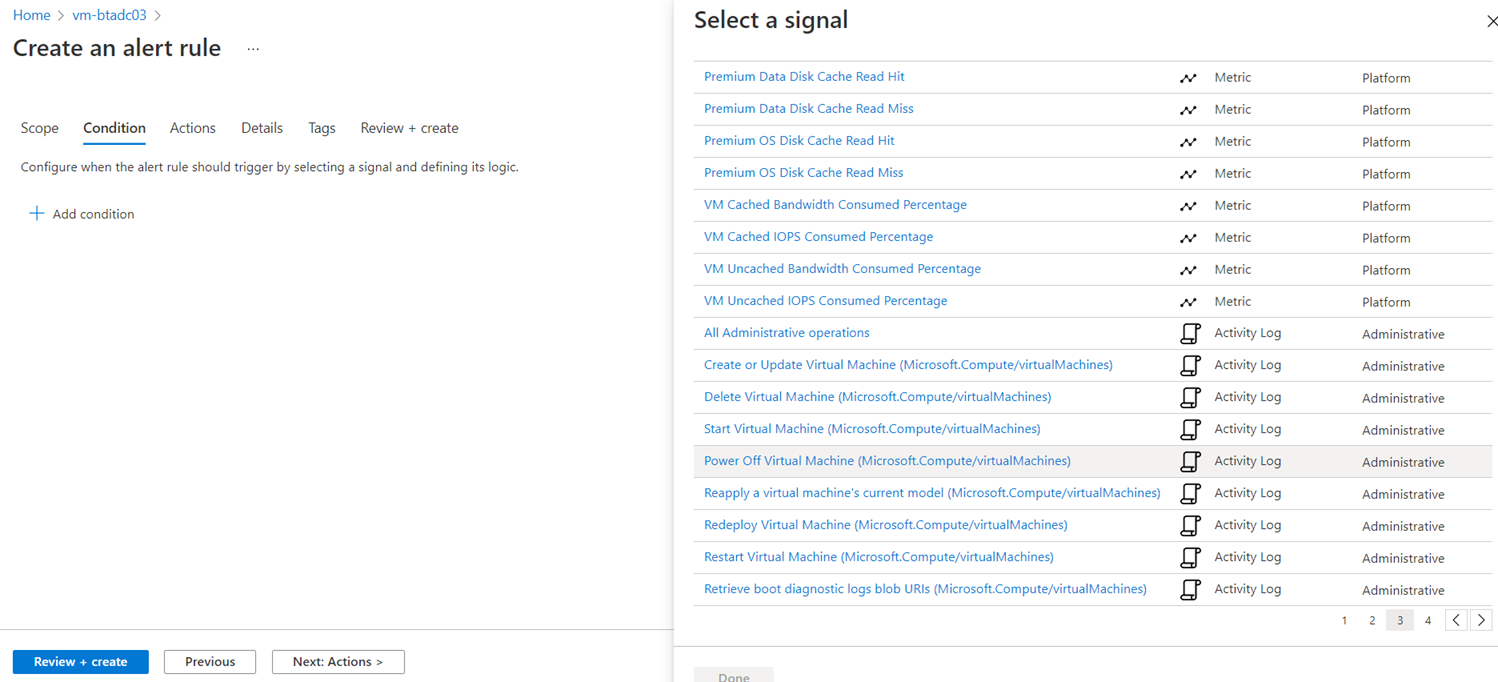
For the purpose of this example, we’ll be using the Signal type Activity Log Power Off Virtual Machine (Microsoft.Compute/virtualMachines) as shown in the screenshot below:
It is important to note that:
Power Off Virtual Machine (Microsoft.Compute/virtualMachines)
… is not the same as:
Deallocate Virtual Machine (Microsoft.Compute/virtualMachines)
The difference is that if you use the Stop button in the portal UI, it will deallocate the virtual machine and stop the compute instance charges for the VM:
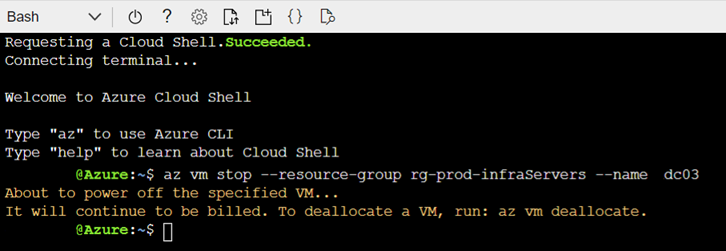
The Power Off Virtual Machine (Microsoft.Compute/virtualMachines) does not fire off an alert when the Stop button is used because of it is looking for scenarios where, say, the following Azure CLI command is executed:
az vm stop –resource-group rg-prod-infraServers –name dc03
The command above will stop the operating system but charges for the instance will continue, which is probably not what is intended.
—————————————————————————————————————————-
With the monitoring signal type explained, let’s proceed to finishing creating the alert by leaving the rest of the condition default:
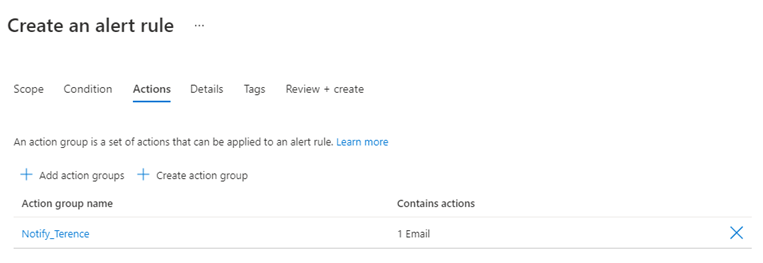
Select the previous action group we defined, which sends an email, for the action group:
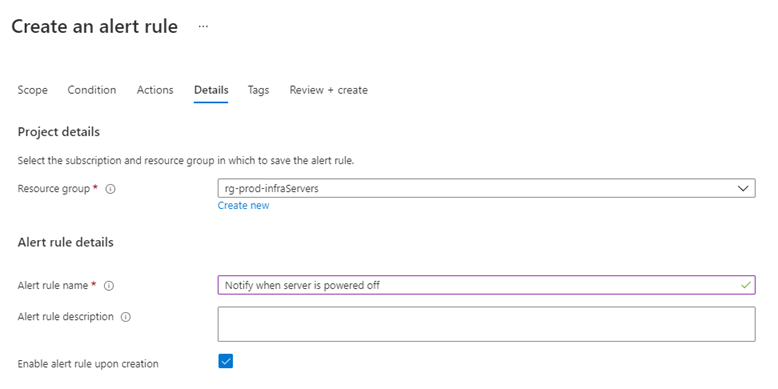
Fill in the fields for the Details tab:
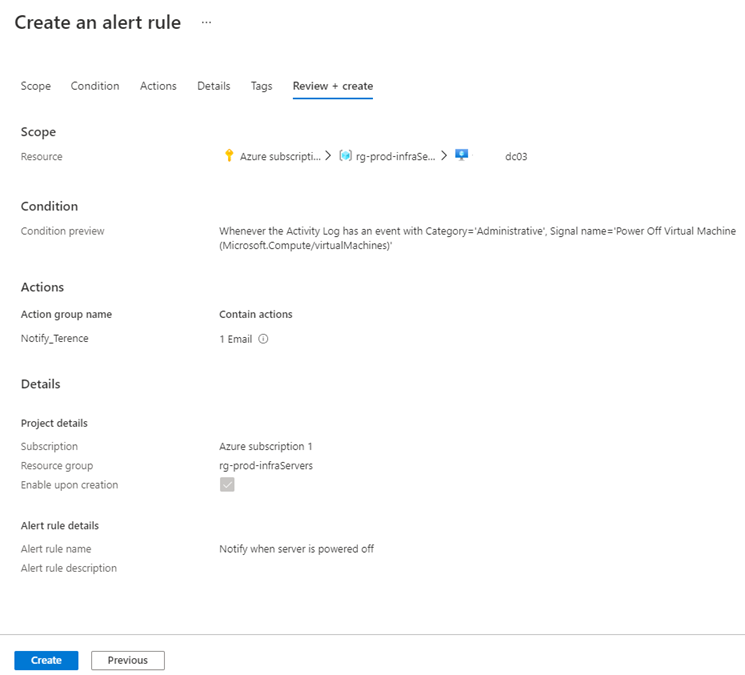
Review and create the alert:
I’ve noticed that the alert can take a few minutes to show up in the portal so give it a bit of time:
With the alert configured, proceed to power off (not deallocate) the VM:
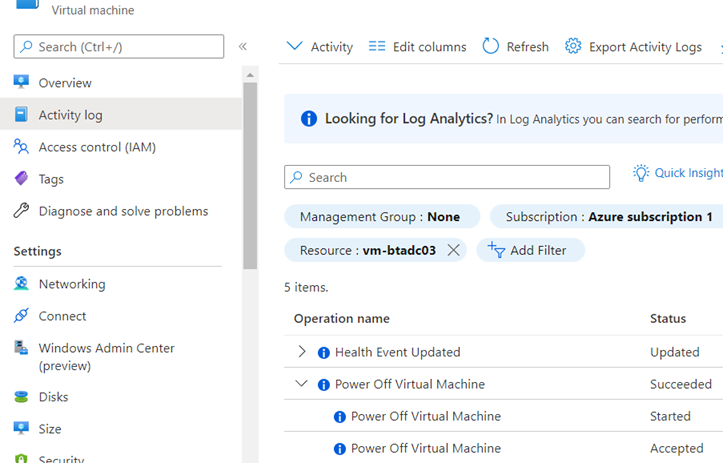
You should see the following entry logged in the Activity Log for the virtual machine:
Clicking into the Alerts for the virtual machine will display the alert generated by powering off the VM:
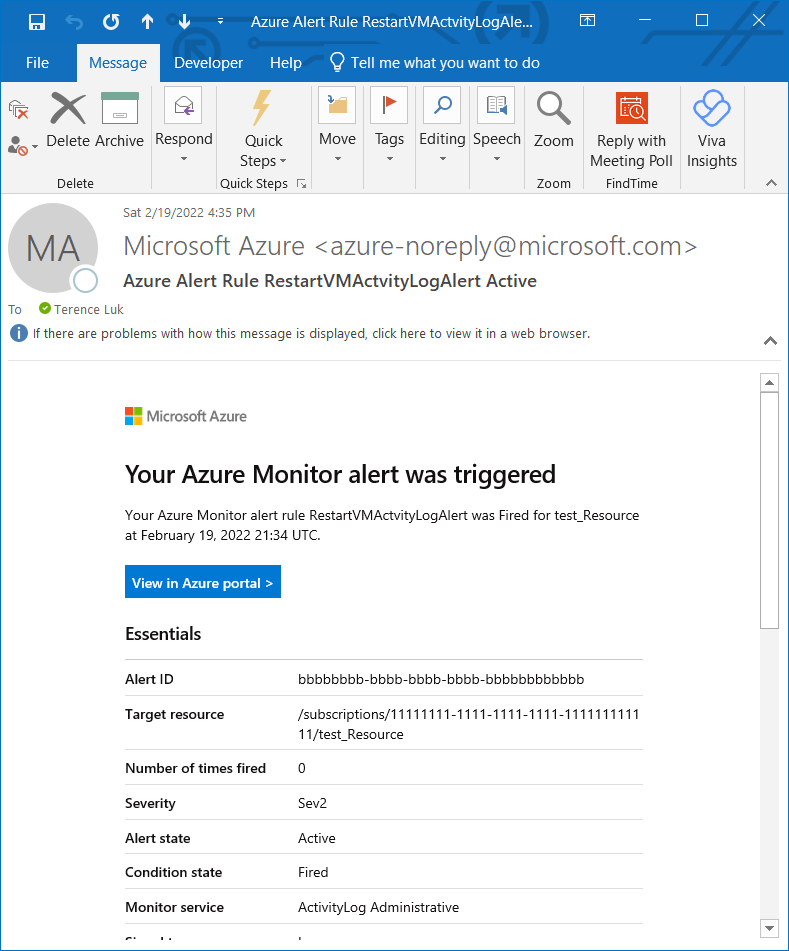
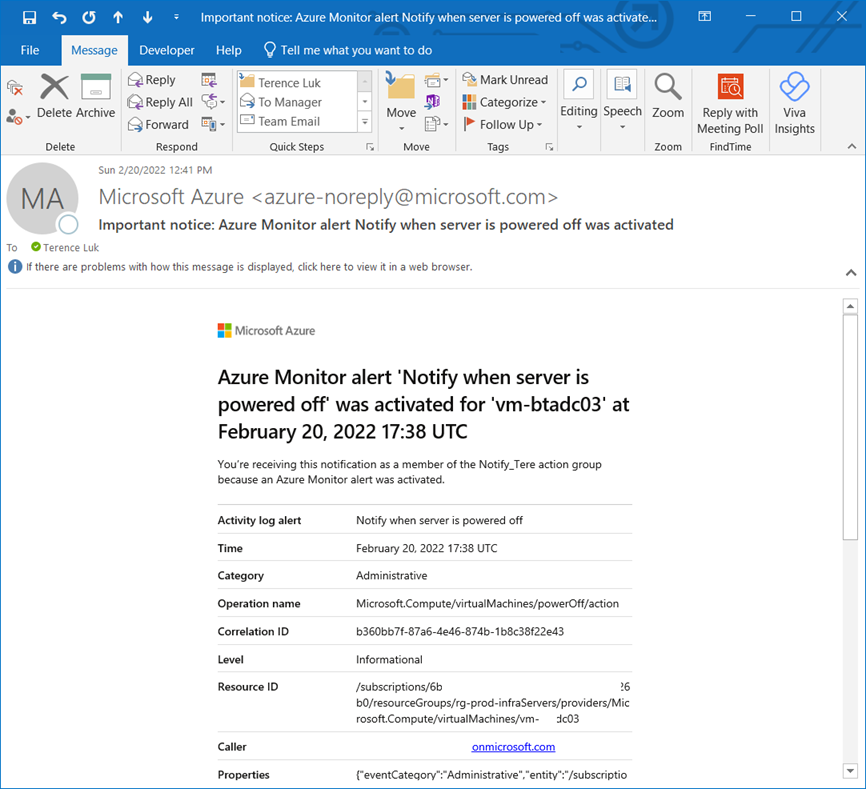
You should also receive an email notification alert:
I hope this blog post is able to provide information on how Azure Monitor works when monitoring a virtual machine and a clear demonstration on how to set up the monitoring and alerting. A follow up post for automation will be written soon.


