An ex-colleague recently reached out to me for assistance on how he could perform a network trace and analyze it for a particular Citrix Virtual Apps and Desktop environment and the most common tool I usually recommend is Wireshark. The challenge he had was that the Wireshark installation would error out during the NCAP install so attempting to use that tool was not a viable option.
My ex-colleague’s challenge lead me to remember another method I had used in the past (probably more than 5 years ago) where we could use the native netsh trace command to capture an ETL file without requiring any software installation and after successfully testing the process, I thought I’d write a blog post to demonstrate it.
Creating a network trace capture file on the virtual desktop
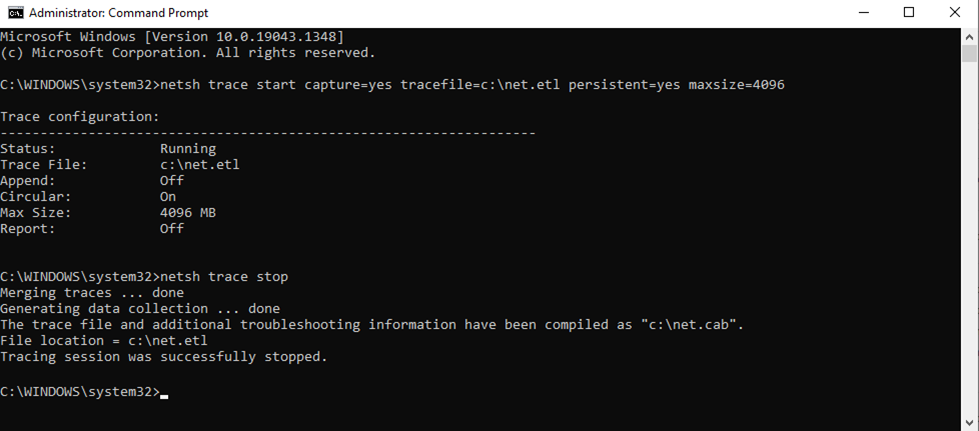
1. On the VDI, launch the command prompt in administrator mode and start a trace with the following command:
netsh trace start capture=yes tracefile=c:net.etl persistent=yes maxsize=4096

2. Replicate issue, note the time stamp, and stop trace with the following command:
netsh trace stop
Analyzing the network trace
- Download and install Microsoft Network Monitor: https://www.microsoft.com/en-in/download/details.aspx?id=4865
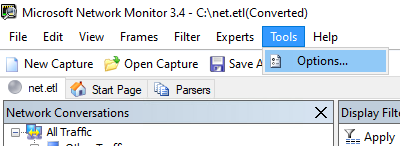
- Launch Microsoft Network Monitor and open the ETL file:
- Click Tools > Options:
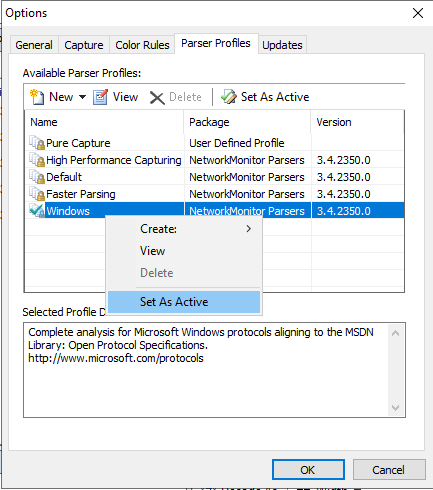
Navigate to Parser Profiles tab, right click on Windows and click Set as Active:
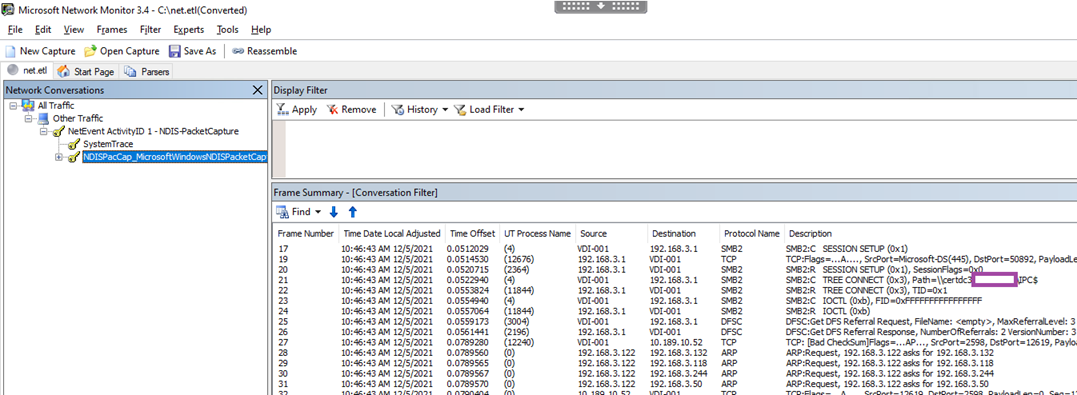
Drill down to the NDISPacCap node:
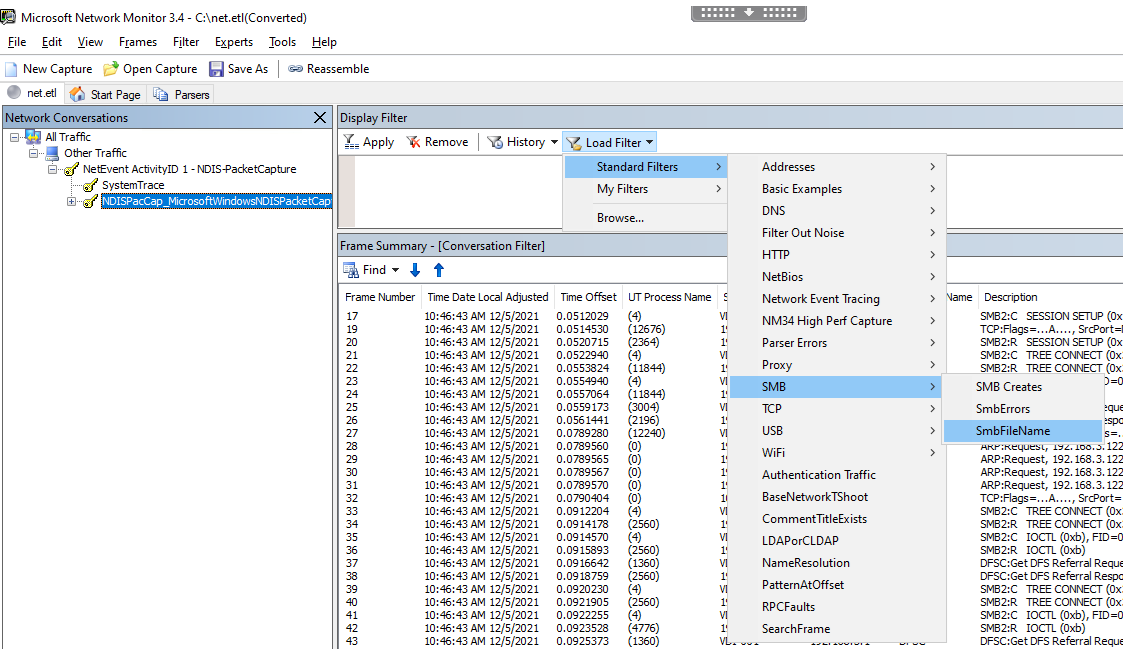
For the purpose of this demonstration, we’ll be searching for an SMB path that contains the string college.
Click on Load Filter > Standard Filters > SMB > SmbFileName:
Update the string to look up and click Apply:
Hope this helps anyone who may be looking for a alternative method for capturing network traffic and analyzing it in an environment that may not have Wireshark available.

