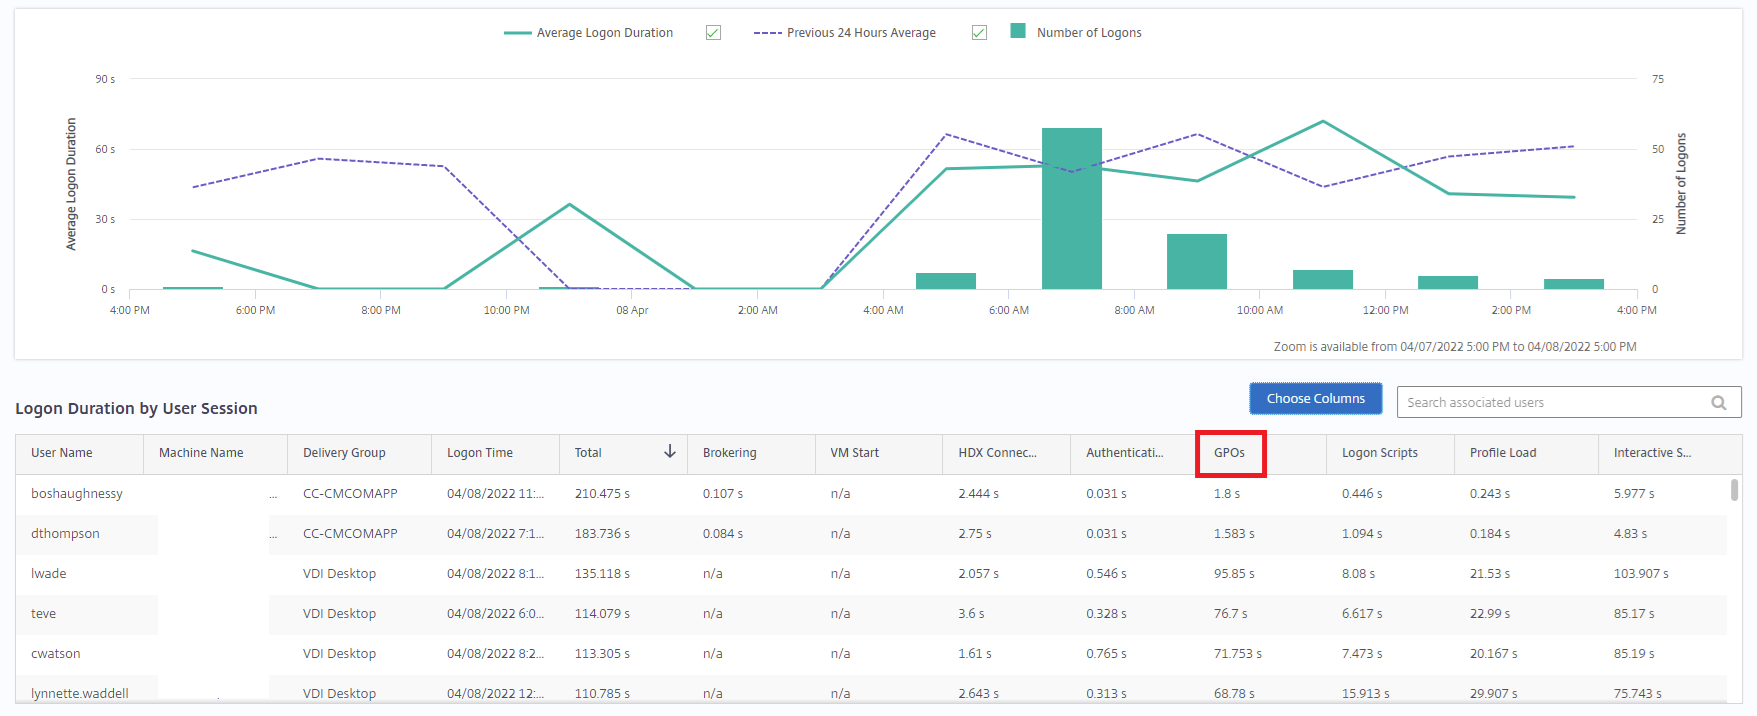
I’ve recently been involved in a few virtual desktop architecture design and one of the topics I was asked to discuss was around the monitoring of the virtual desktops. Having worked with Citrix and VMware VDI solutions, I’ve always enjoyed the “out of the box” monitoring solutions Citrix Director (shown in the screenshot below) and VMware Horizon Help Desk Tool that were included.
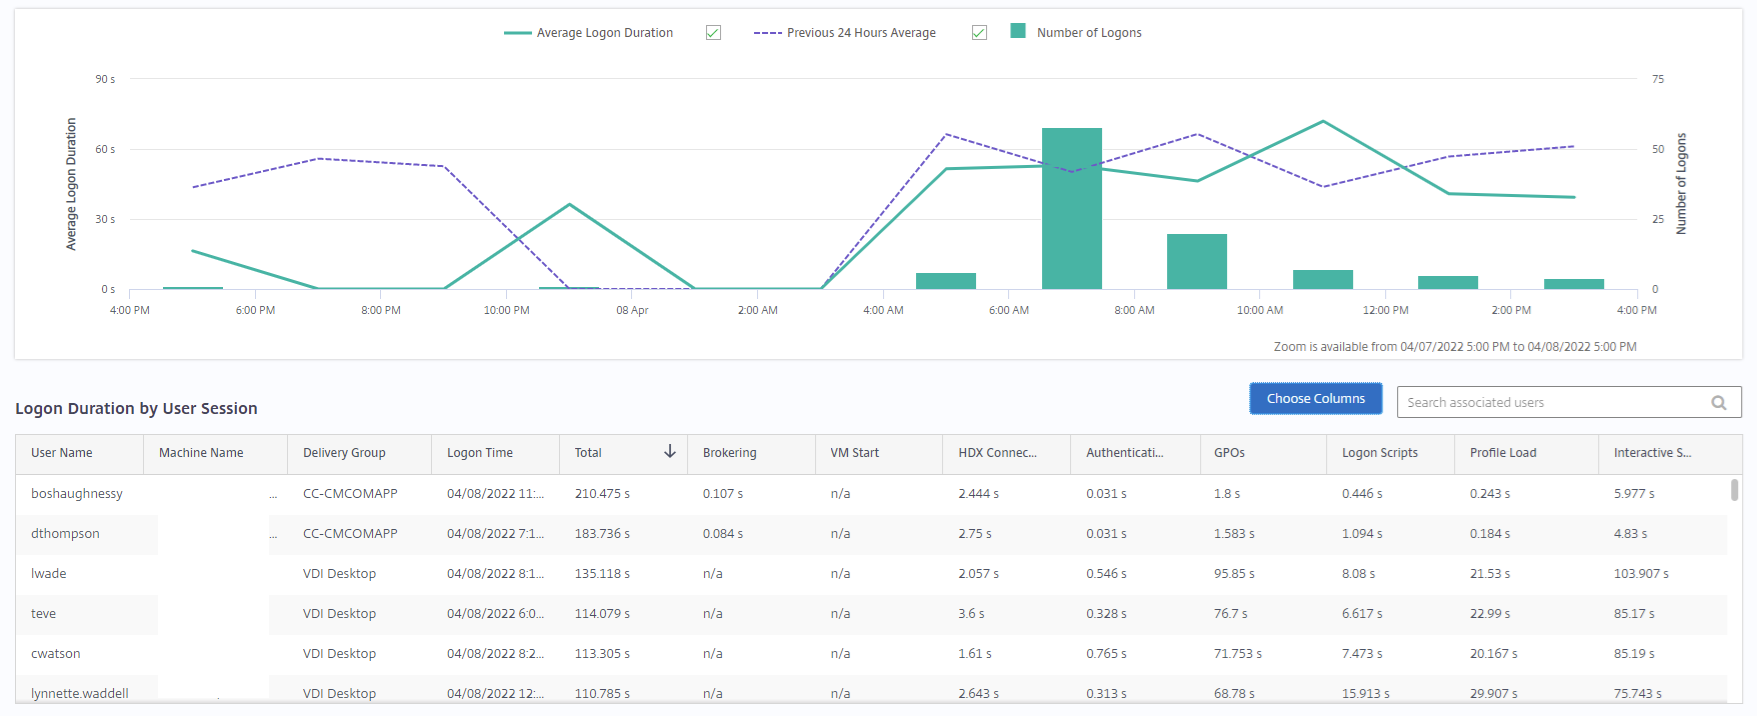
The metrics and visualization that these tools provided were extremely valuable for understanding the overall health and troubleshooting when issues arise. Those who worked with Azure Windows Virtual Desktop in the very beginning will remember that these metrics were possible but an investment of time were needed to develop the kusto queries to retrieve the capture metrics from Log Analytics so dashboards could be created. The professionals in the Azure community provided many prewritten queries, workbooks and even Power Bi dashboards. Fast forward today, Microsoft has made it extremely easy to capture and include many “out-of-the-box” dashboards with just a few clicks. Furthermore, the log analytics data is still available for anyone who would like to add additional logs and metrics to capture to create customized reports.
There are many great posts available that show up to configure Log Analytics to capture data but some of these manual steps aren’t really necessary today so the purpose of this blog post is to demonstrate how to quickly set up Log Analytics with baseline configuration defined by Microsoft. Upon completion of the setup, we’ll see how many dashboards for monitoring and reports are already available.
Create Log Analytics Workspace to store Azure Virtual Desktop events and metrics
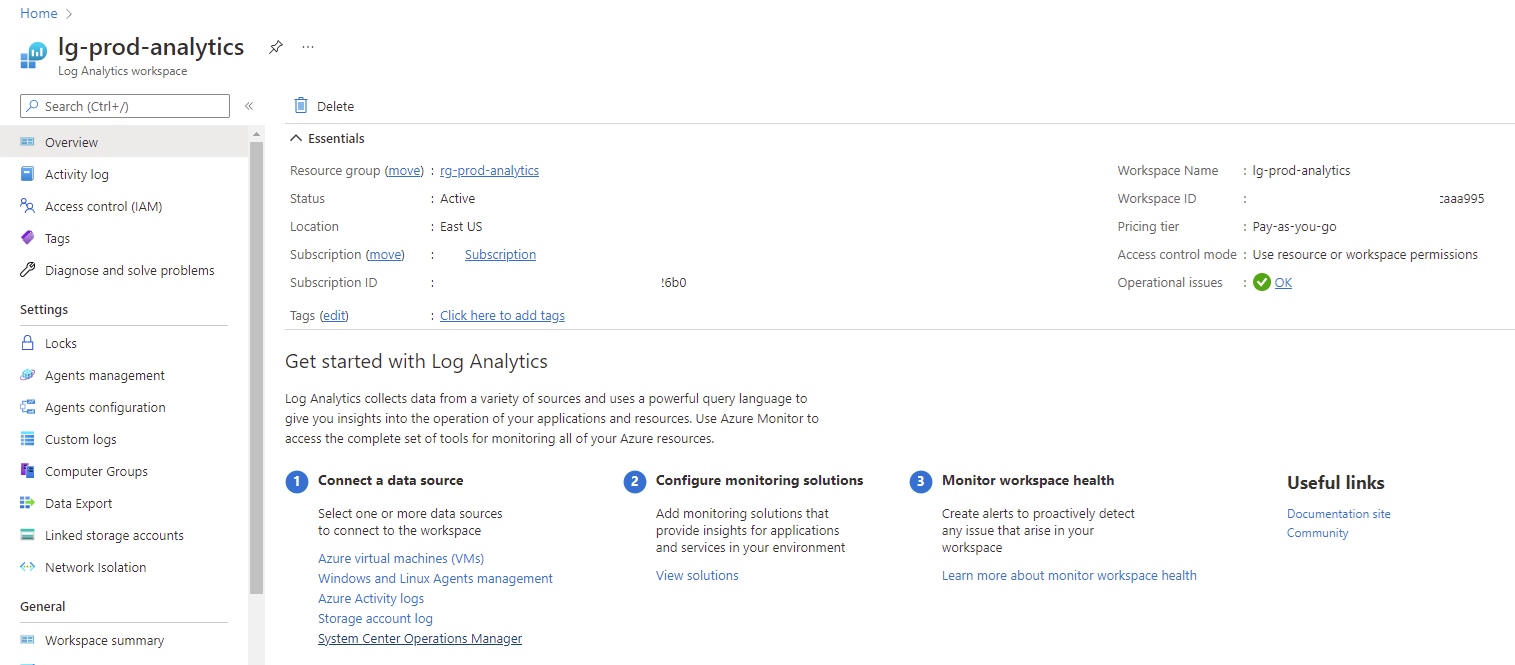
As always, we’ll begin by creating a Log Analytics Workspace that is dedicated to storing the logs collected from the Azure Virtual Desktop components (it is best not to much other logs into this workspace):
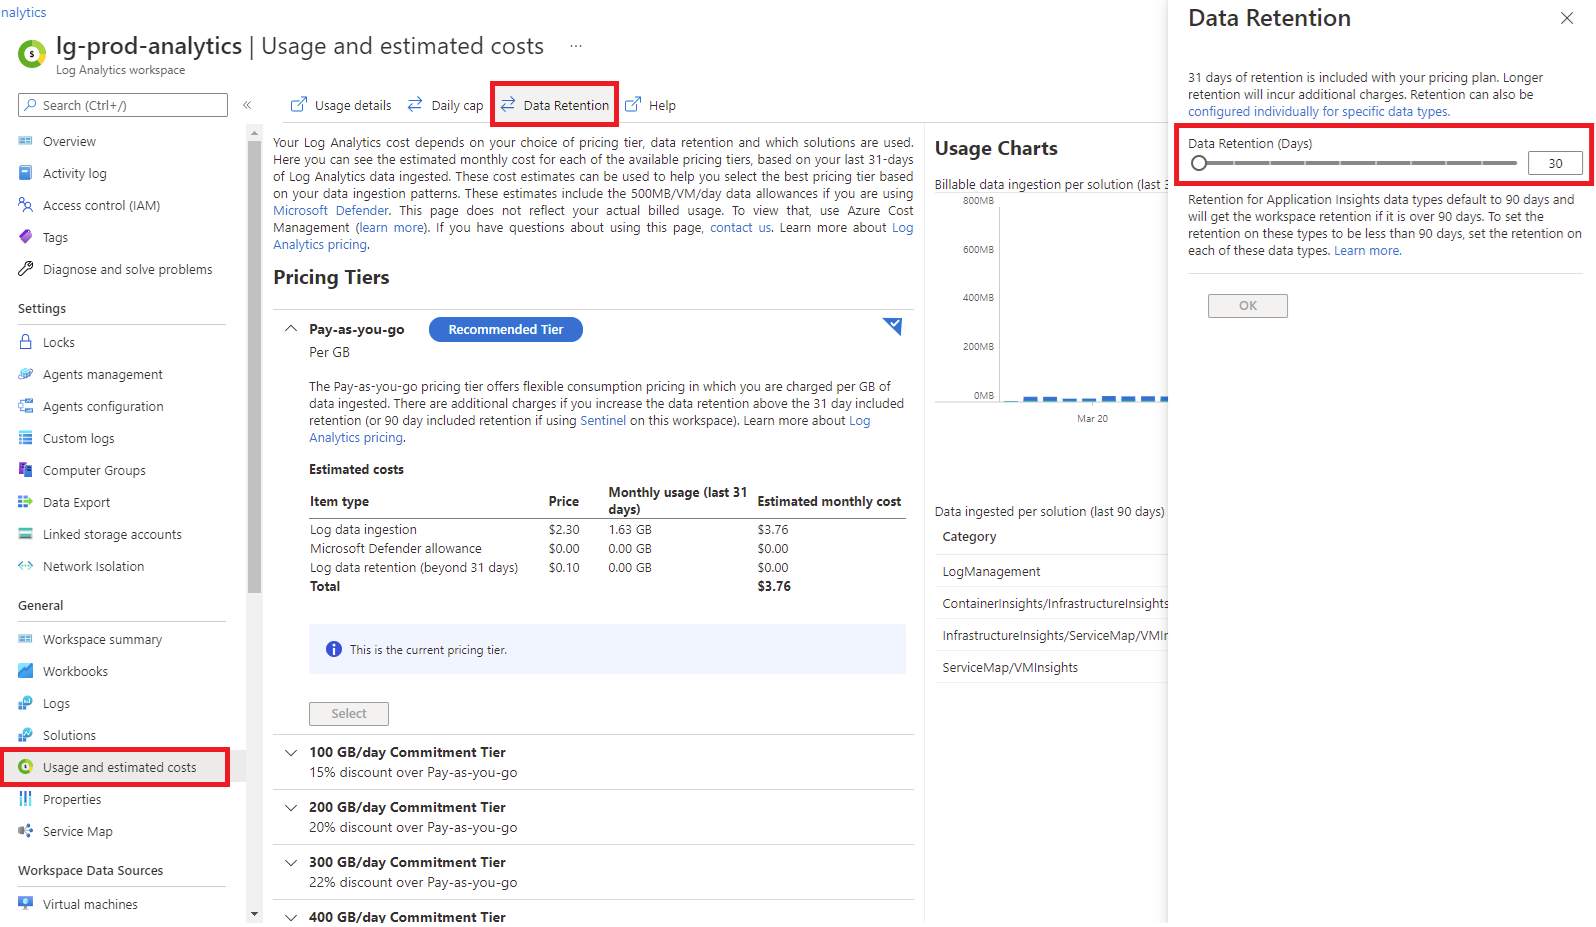
Configure the required retention for the data (the default is 30 days) and be mindful of how much data being ingested according to the size of the deployment:
Set up Configuration Workbook
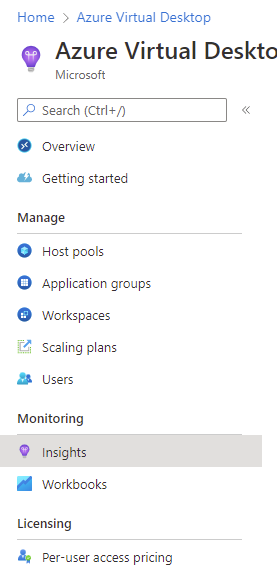
It is possible to proceed to the Azure Virtual Desktop’s Host pools and Workspaces to enabling logging, then configure event and performance metrics monitoring for each session host but this can all be completed by using the Configuration Workbook. Navigate to Azure Virtual Desktop in the Azure portal:
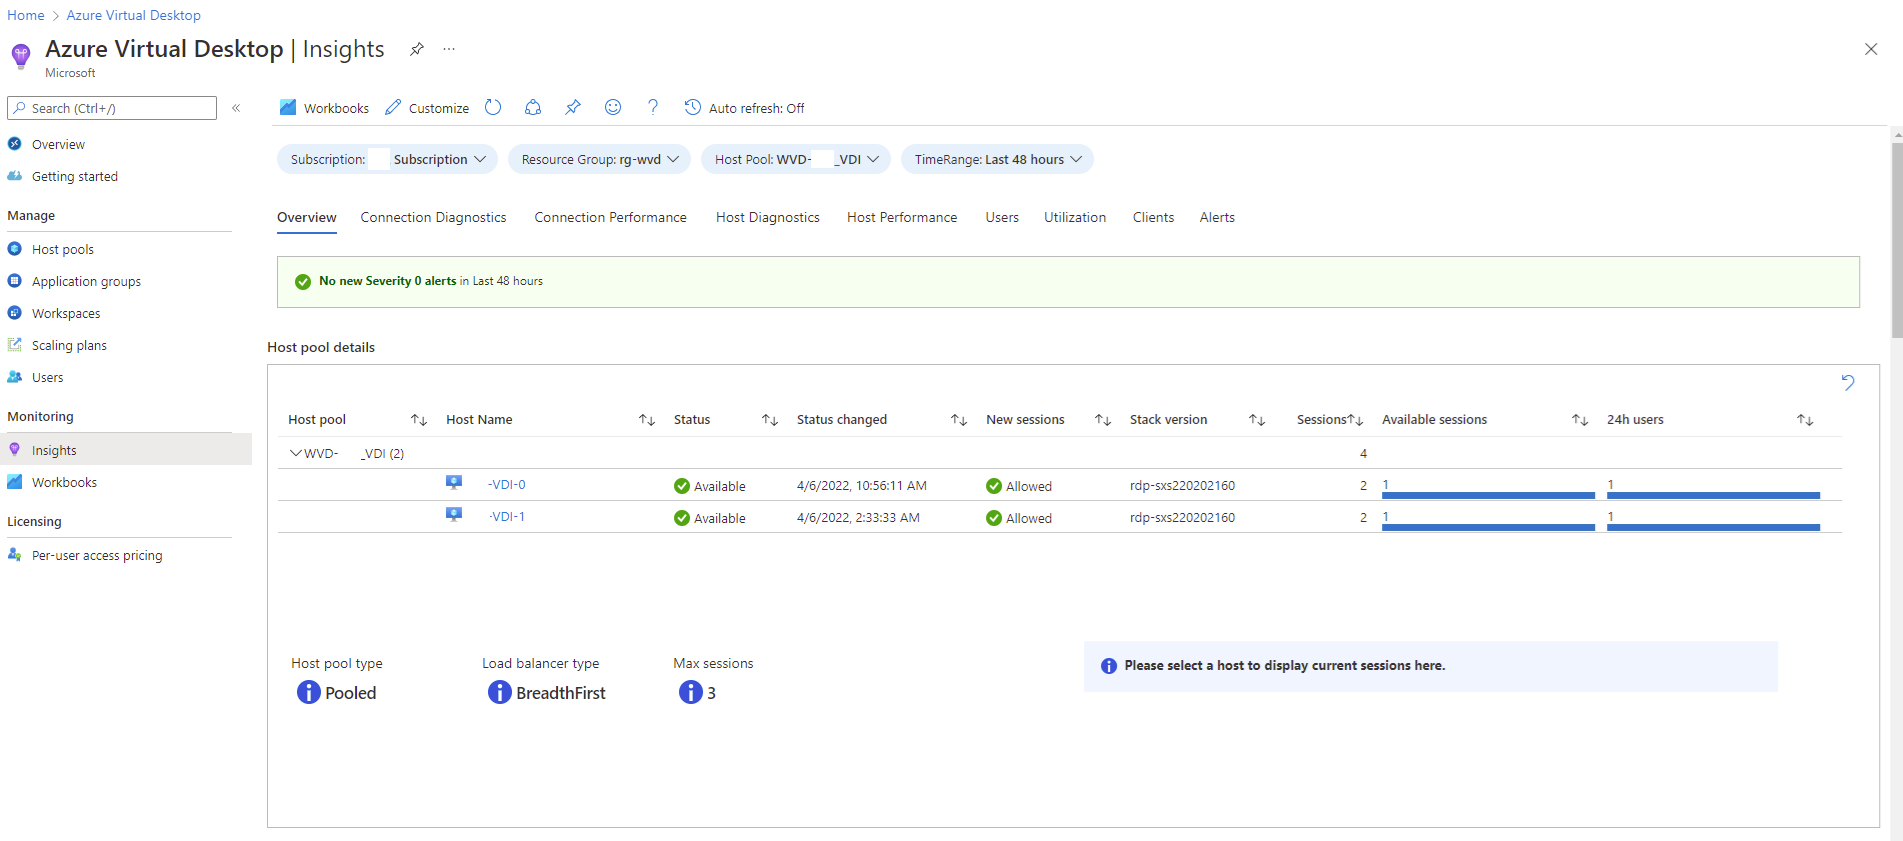
Select the Insights blade, select the Host Pool to be configured and click on Open Configuration Workbook:
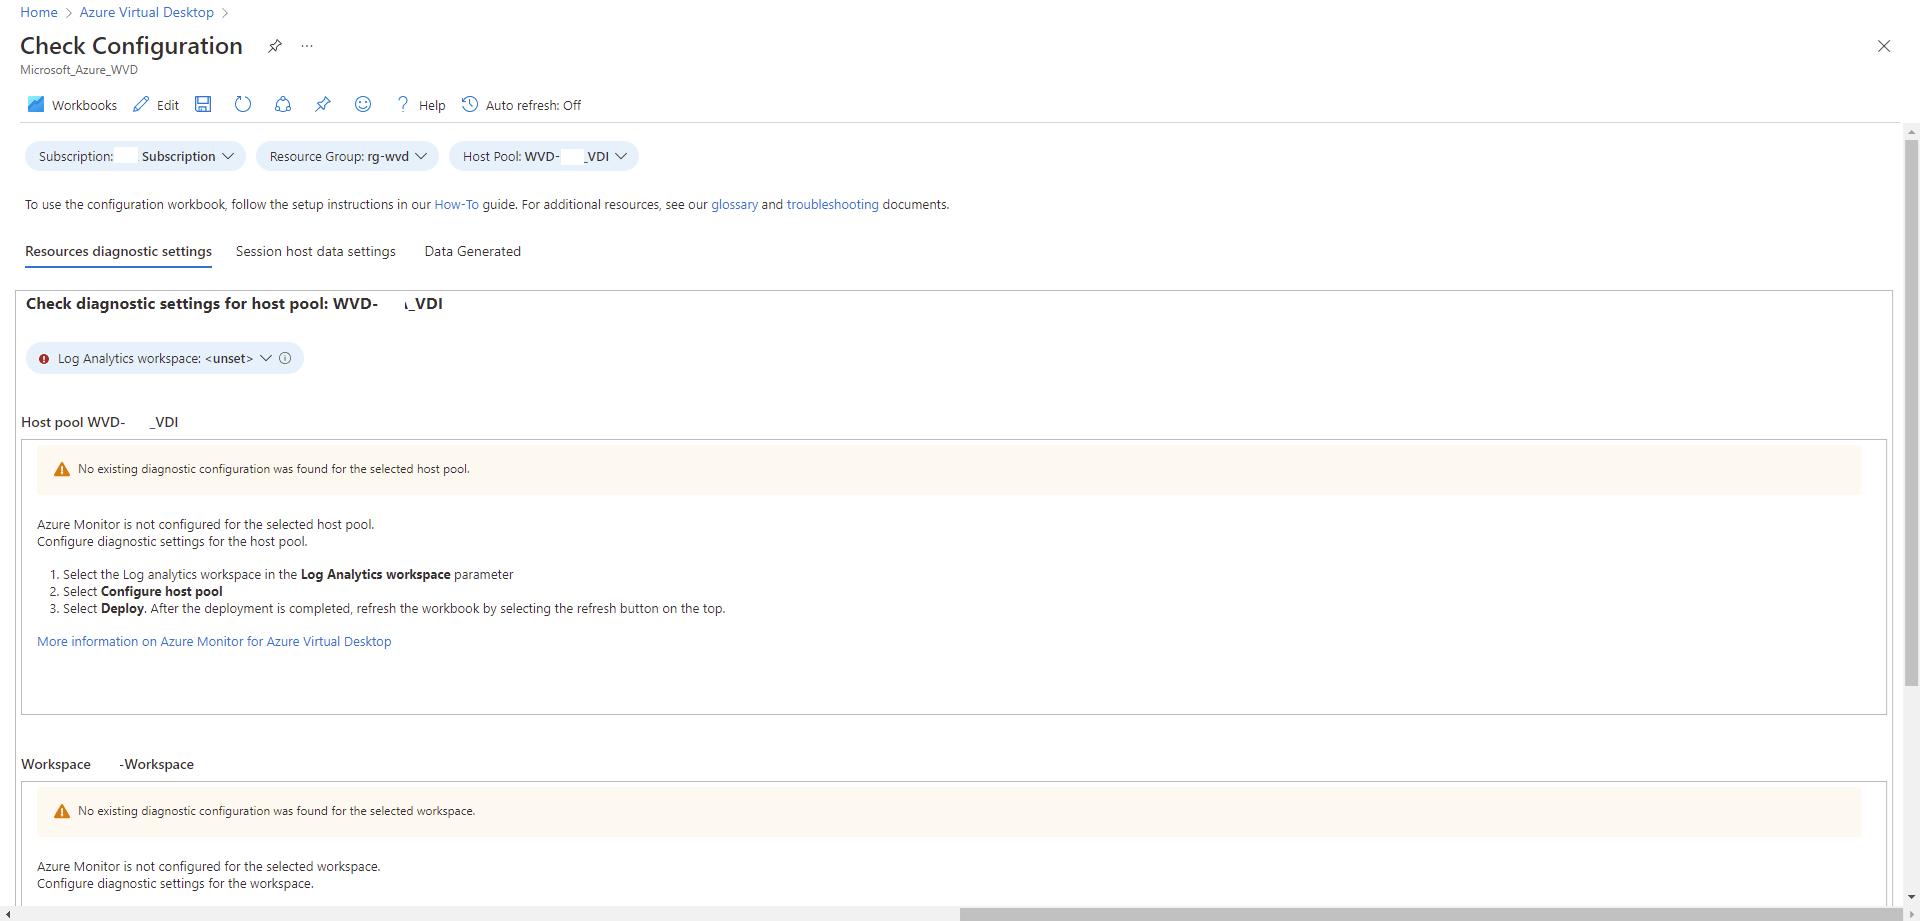
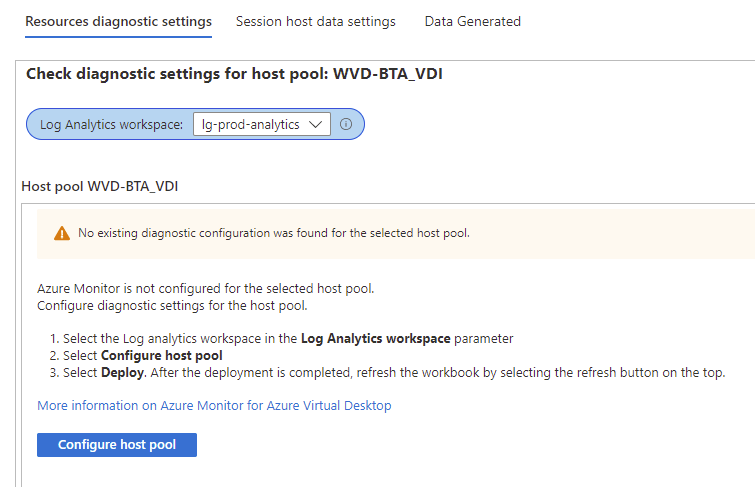
Select the Log Analytics workspace that was configured in the first step and then click on Configure host pool:
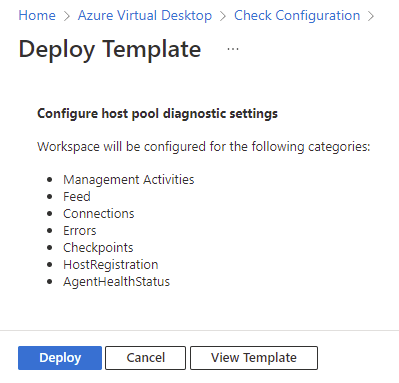
The template for configuring Host pool diagnostic settings will be displayed indicating the following categories will be captured:
- Management Activities
- Feed
- Connections
- Errors
- Checkpoints
- HostRegistration
- AgentHealthStatus
Proceed to deploy the template:
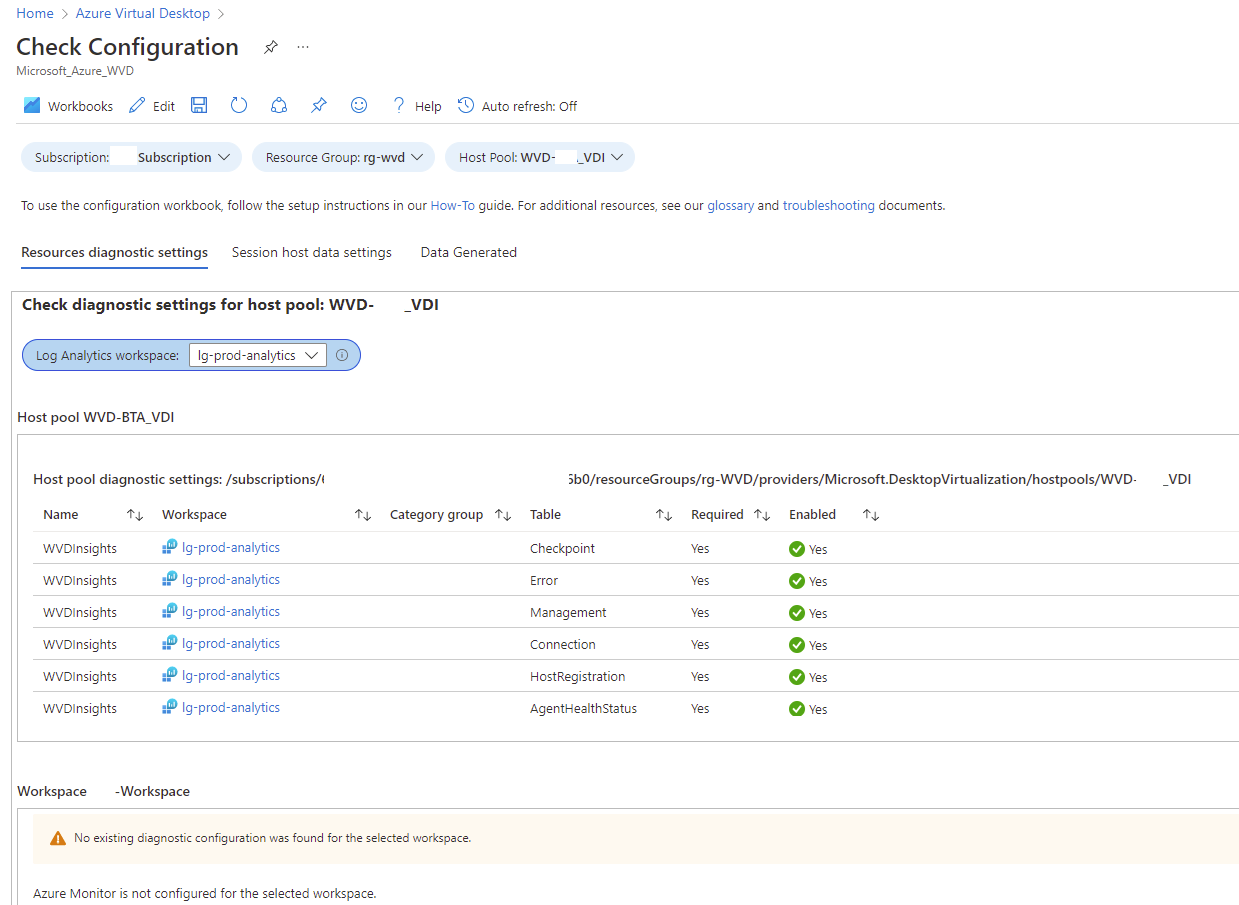
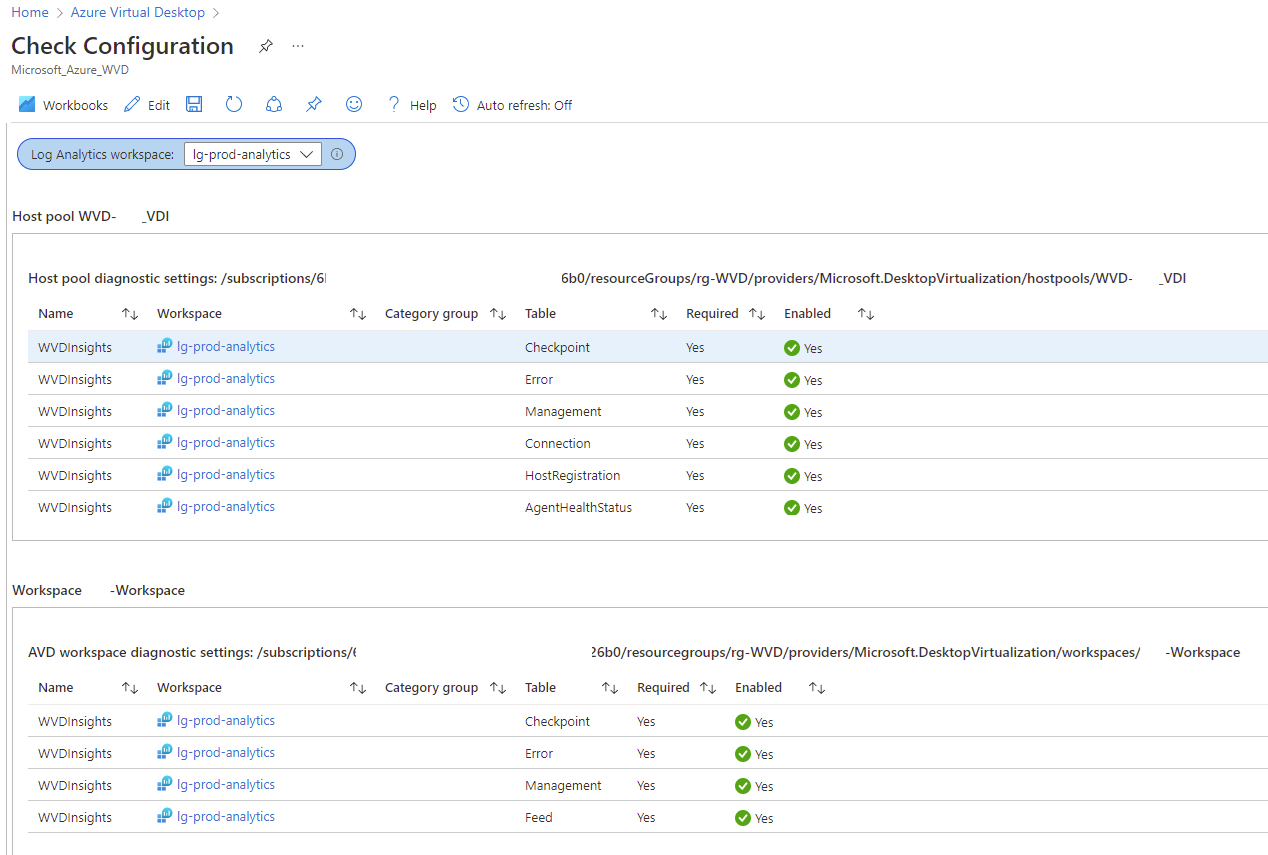
Note that the Host Pool’s Resources diagnostic settings is now configured:
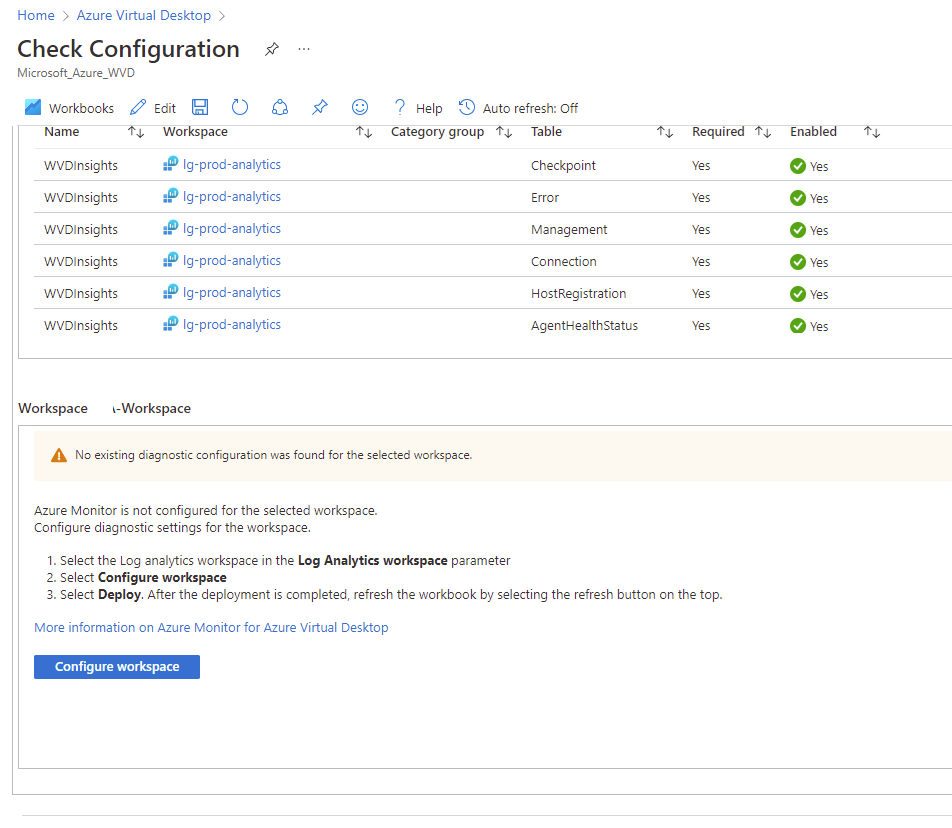
Proceed to scroll down to the Workspace and click on Configure workspace:
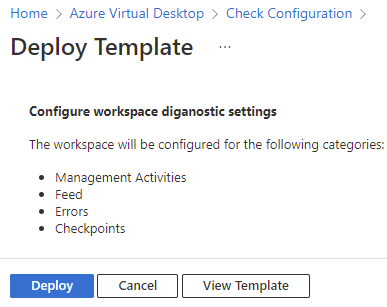
The template for the workspace diagnostic settings will be displayed:
- Management Activities
- Feed
- Errors
- Checkpoints
Proceed to deploy the template:
Note that the Workspace’s Resources diagnostic settings is now configured:
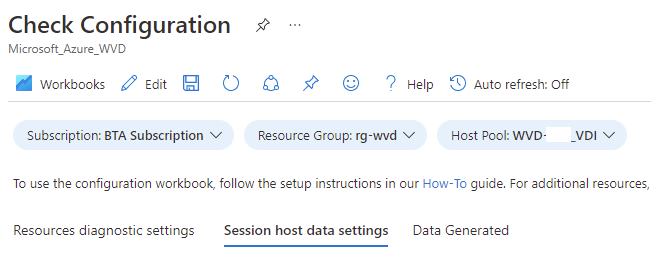
Next, navigate to the Session host data settings tab:
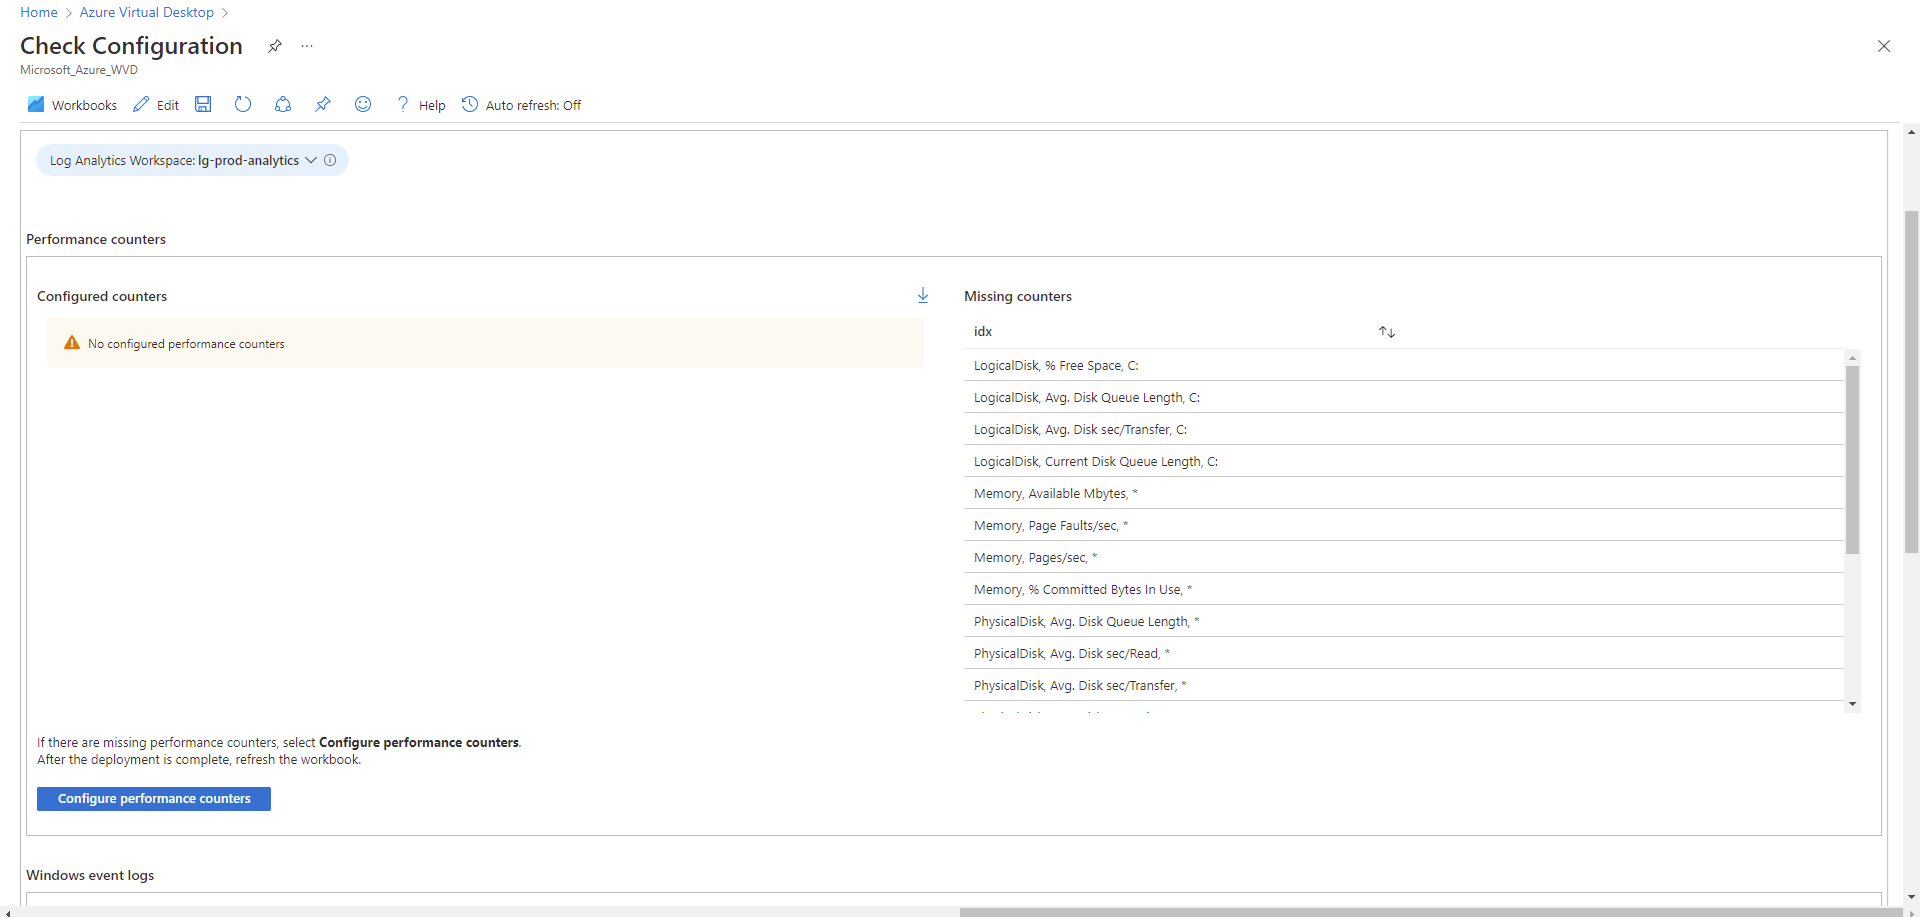
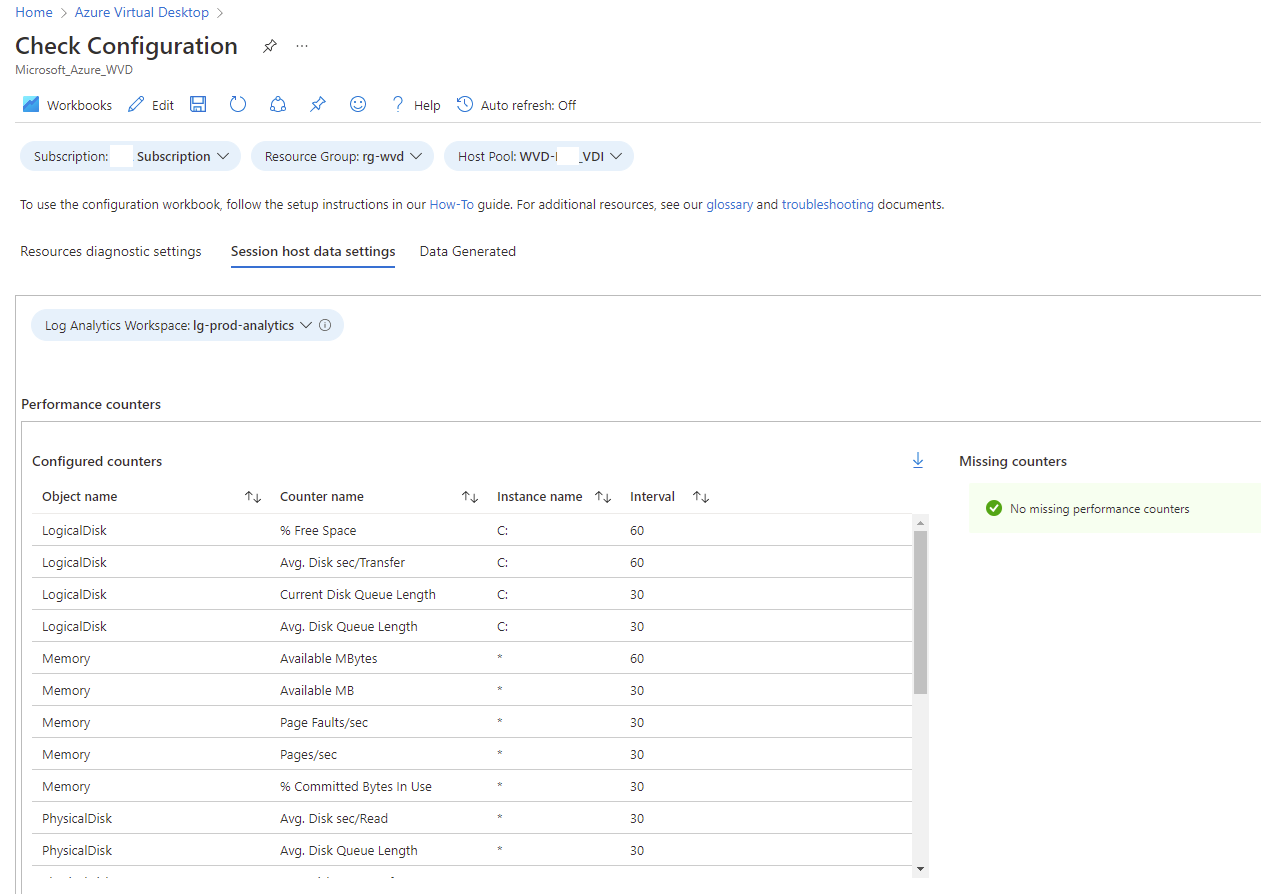
Click on Configure performance counters to capture the recommended baseline counters as displayed on the right under Missing counters:
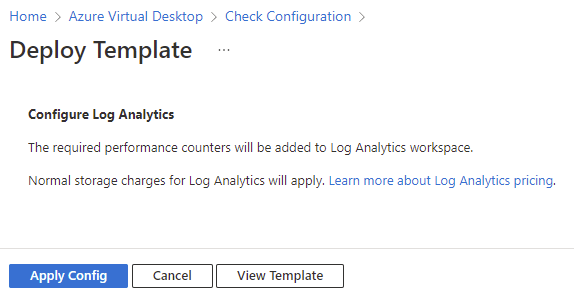
Click on Apply Config:
Note the performance counters that have been successfully added:
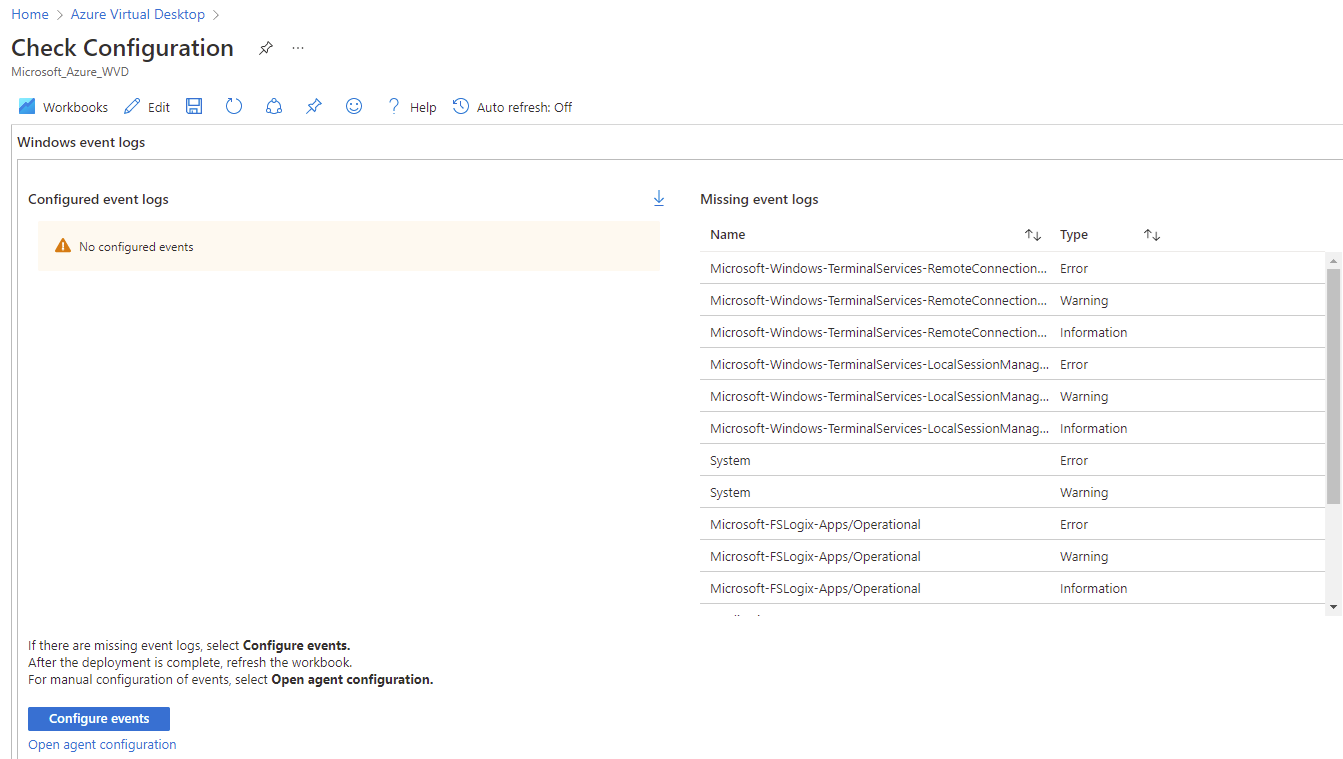
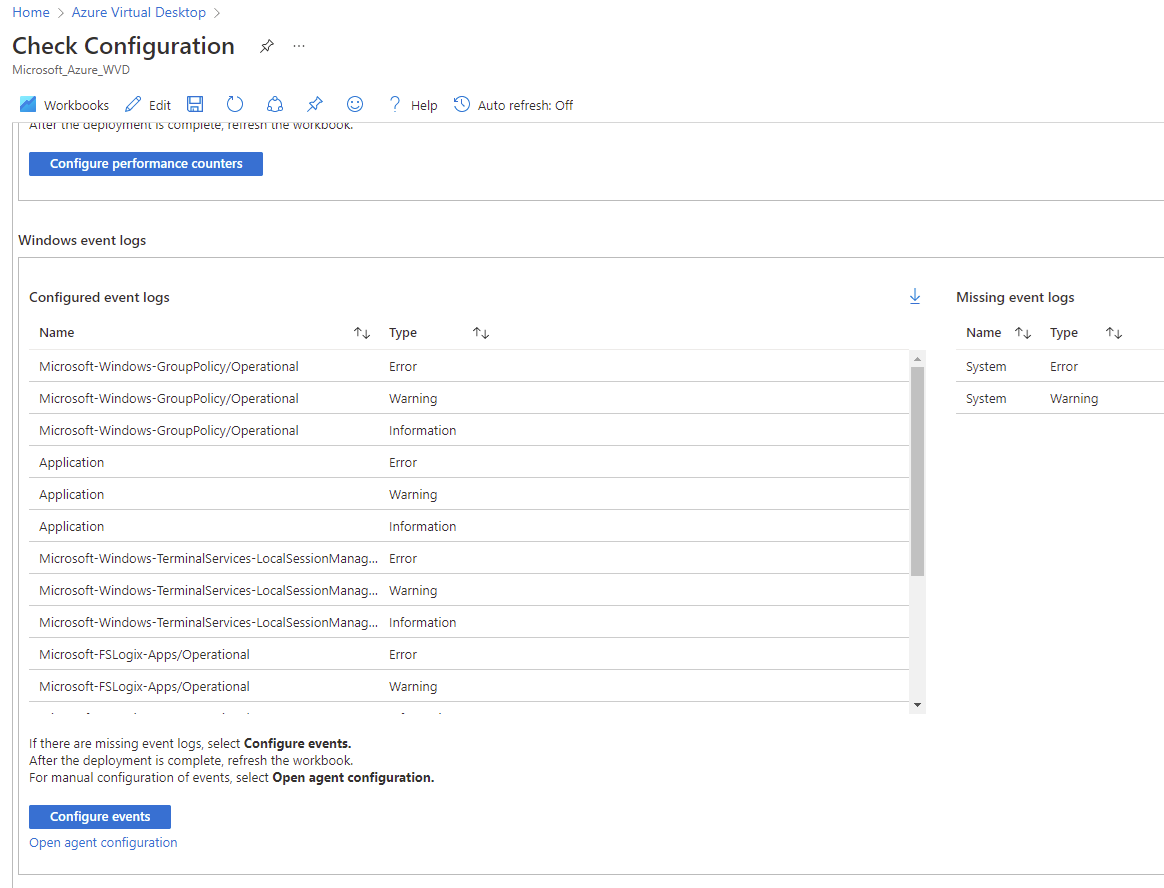
Proceed to configure the recommended event logs to be captured by clicking on Configure events:
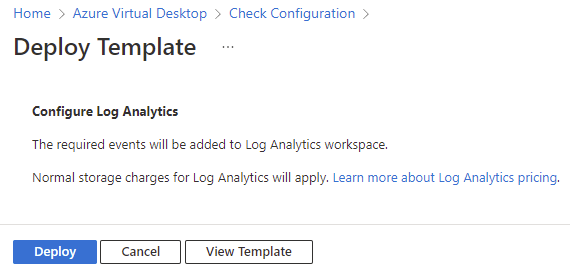
Click on the Deploy button:
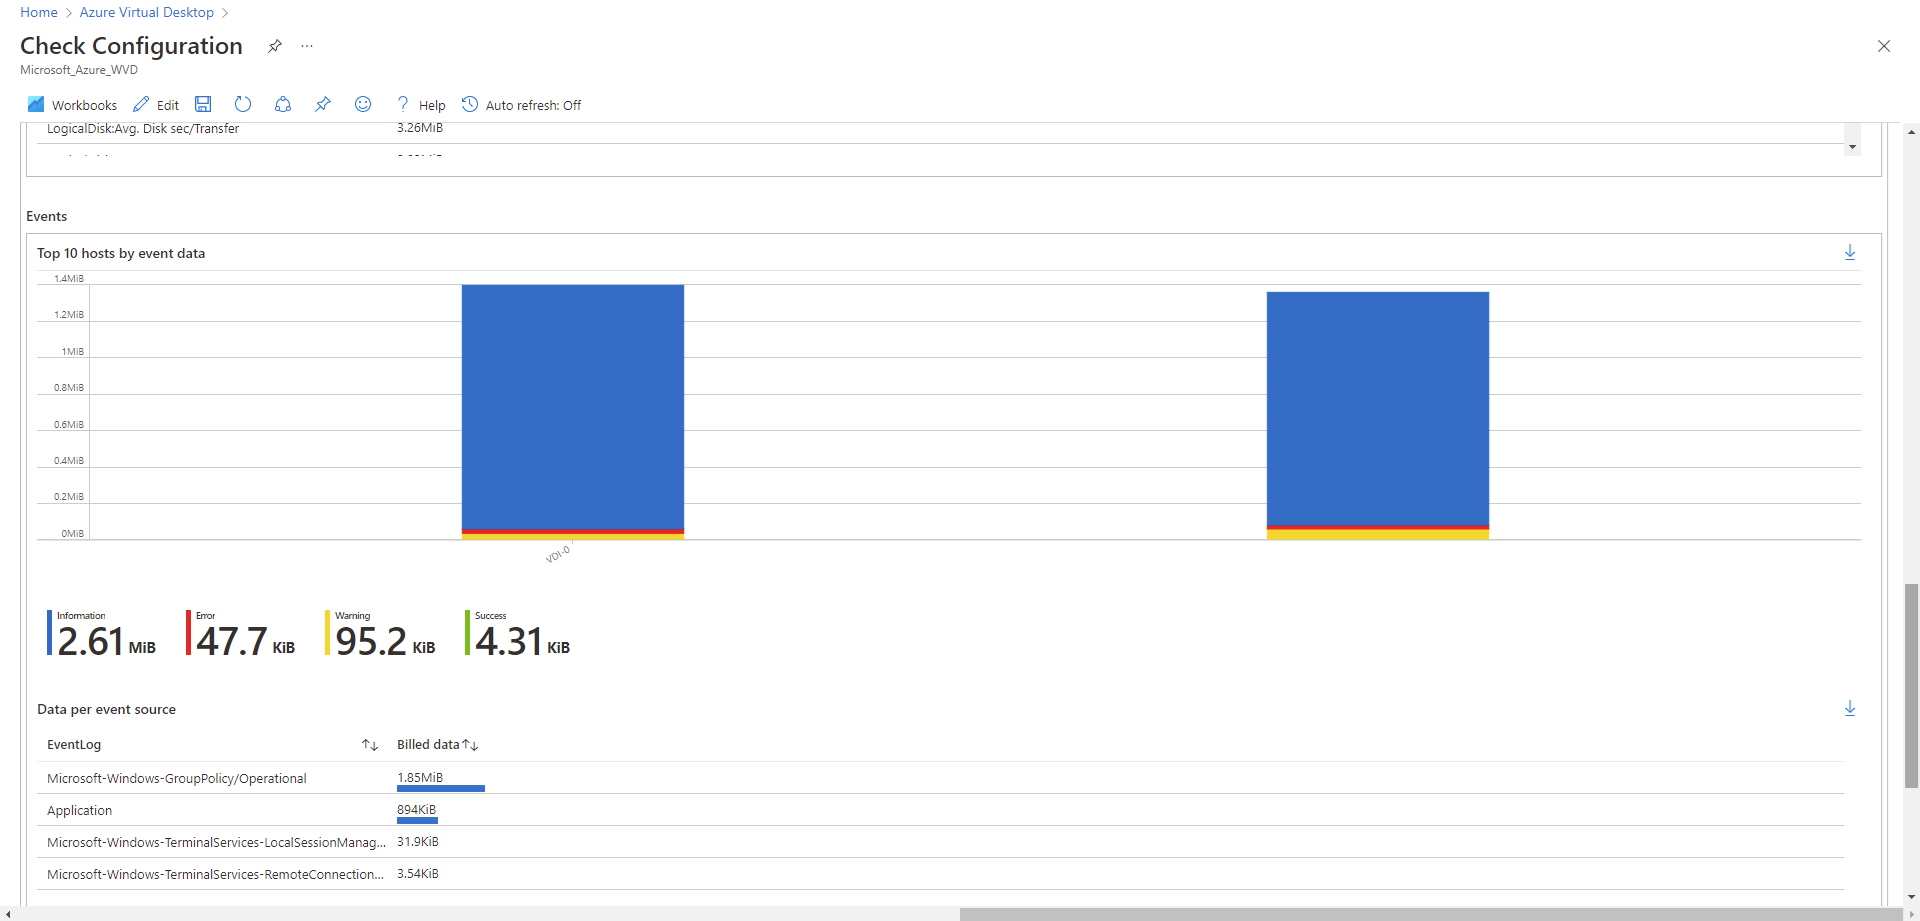
The Windows event logs that will be captured will be listed. Note that the Microsoft-Windows-GroupPolicy/Operational log is not included in the baseline but is one I added (more on this a bit later).
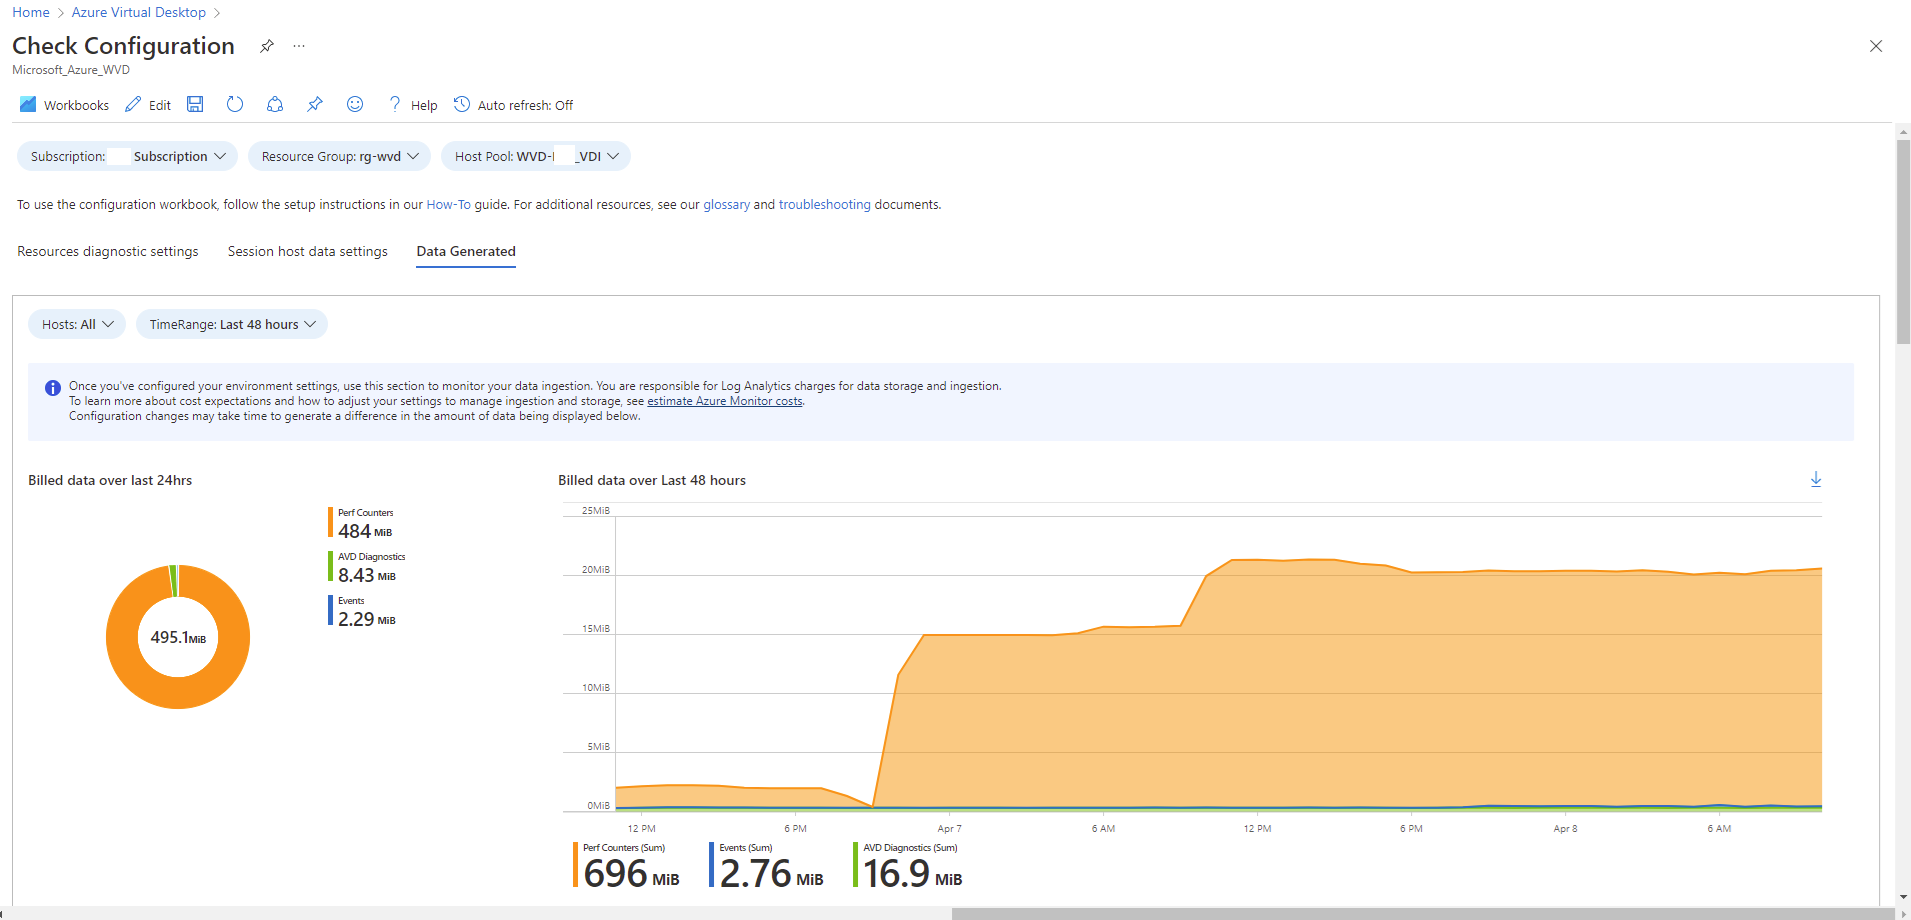
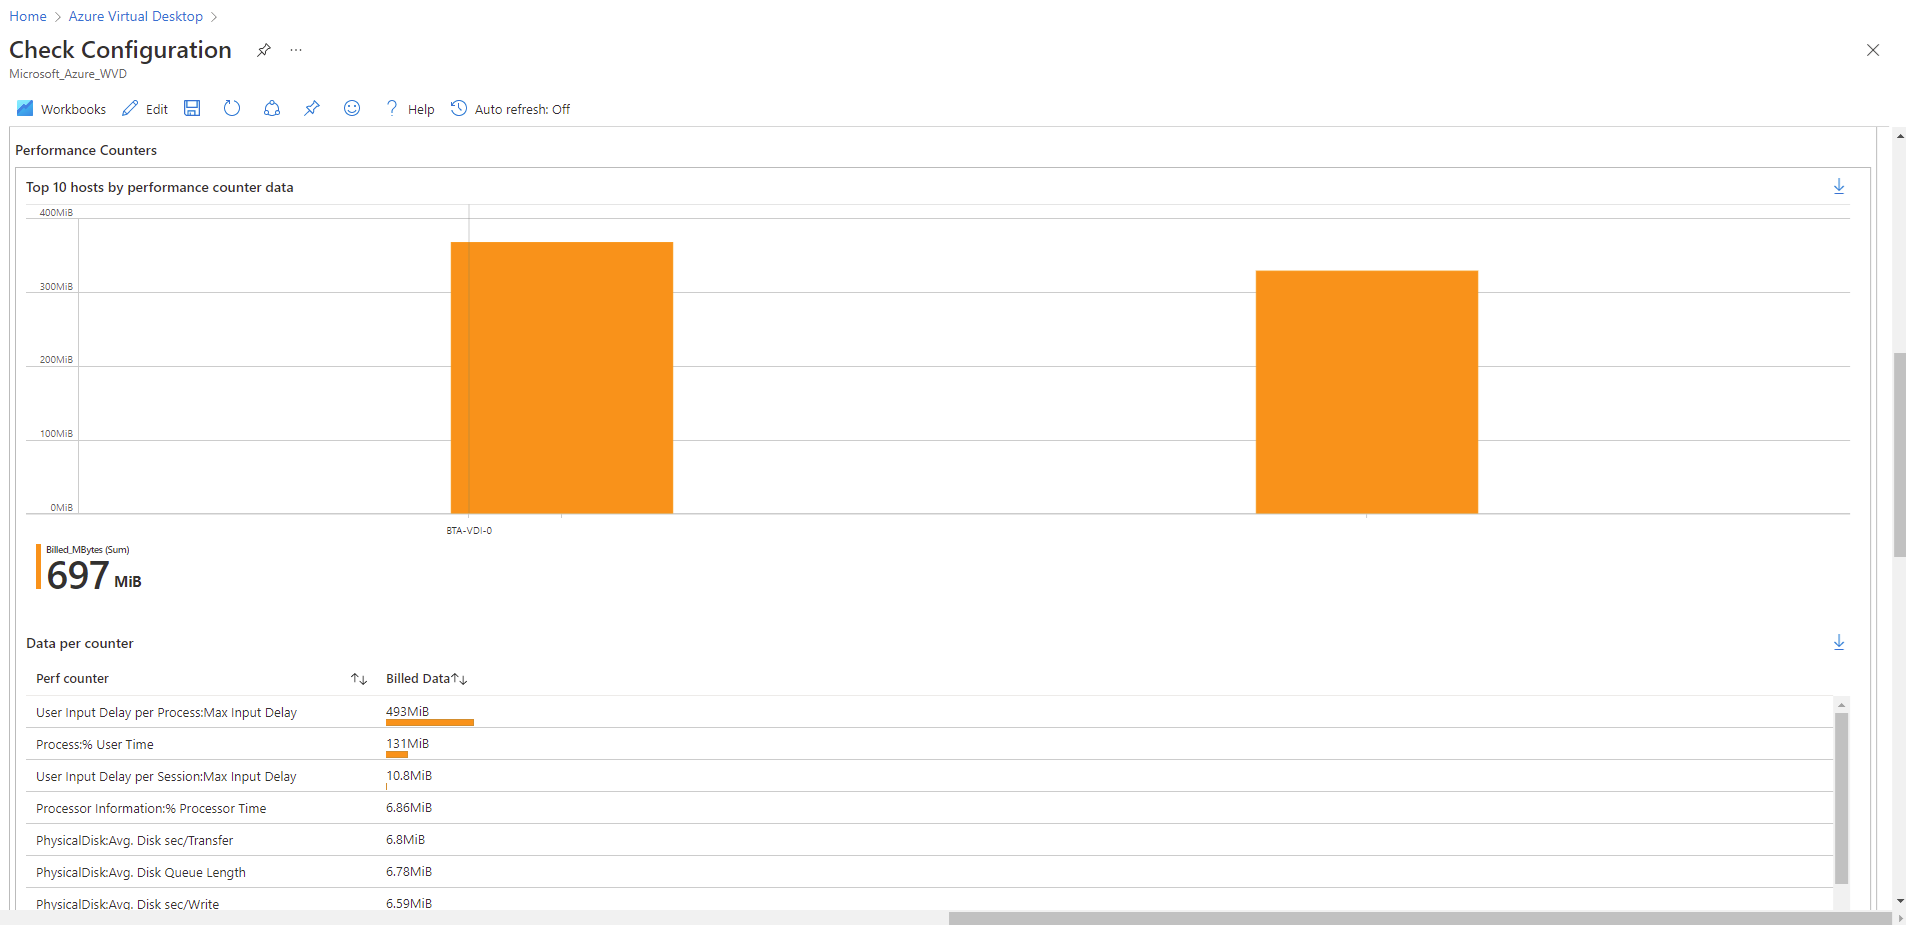
With the Resource diagnostic settings and Session host data settings configured, proceed to the Data Generated tab and a summary of the amount of Perf Counters, AVD Diagnostics and Events billed over the last 24hrs will be displayed. I’ve waited for a few days before capturing the screenshot so metrics would be displayed:
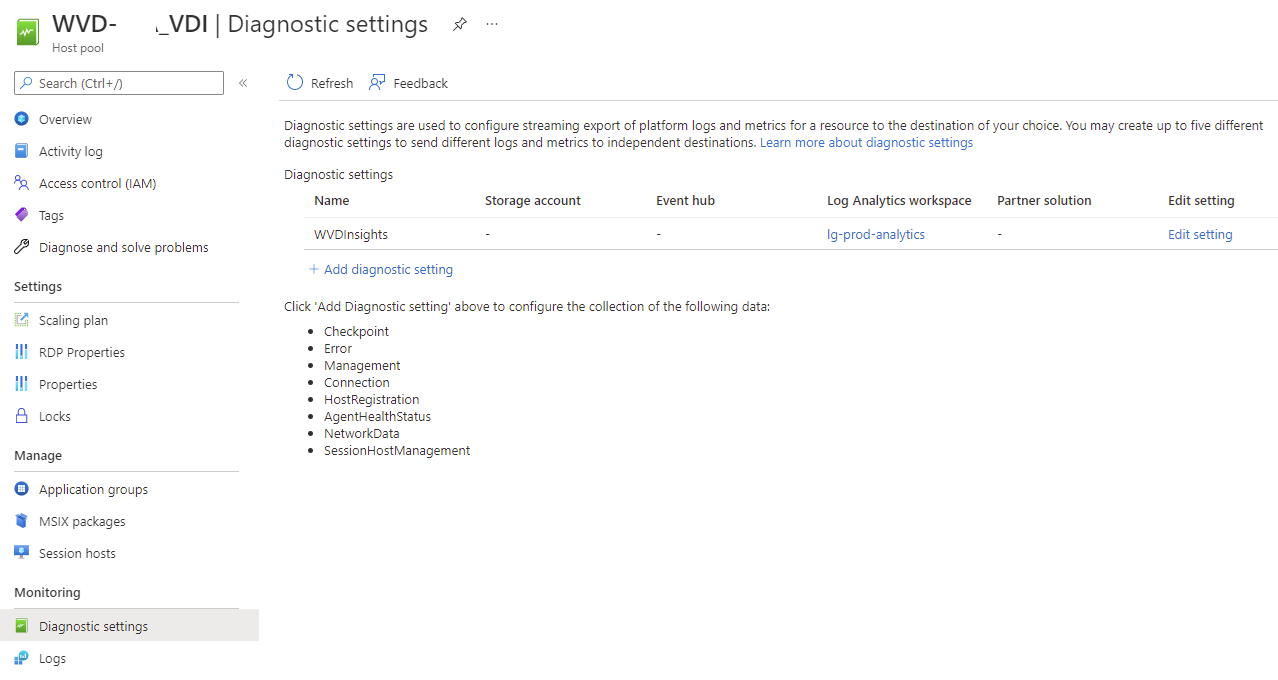
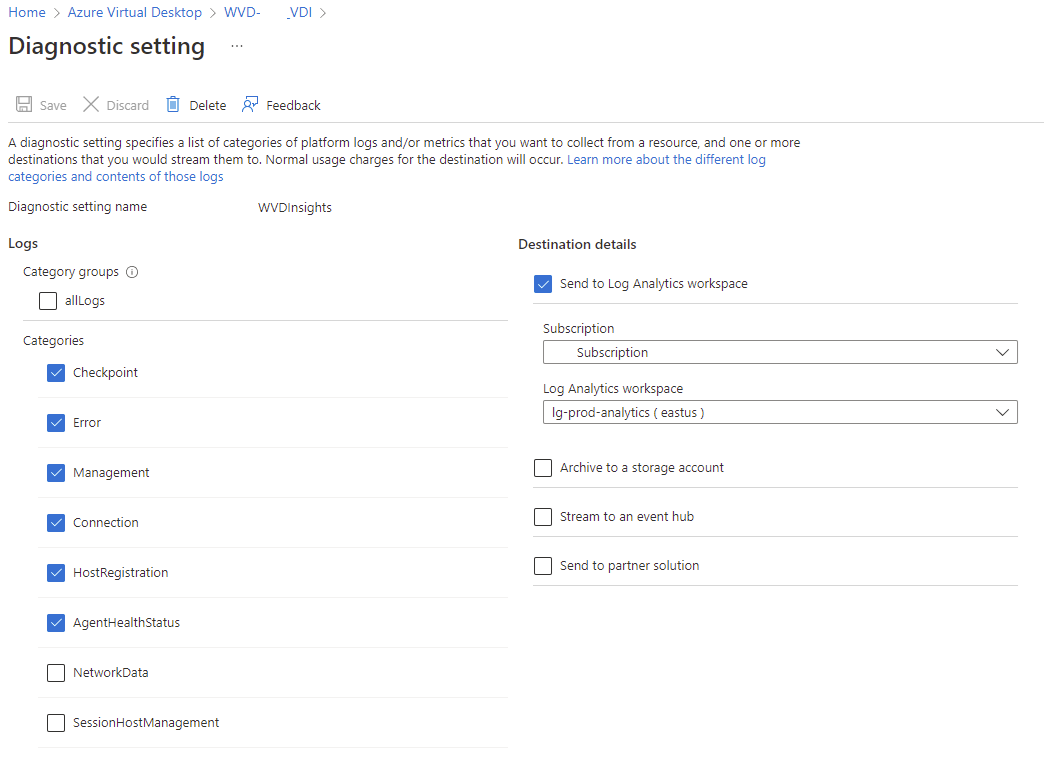
If we navigate to the Host Pool blade of the Azure Virtual Desktop deployment and click on the Diagnostic settings, we’ll see the configuration we have just completed. Some administrations will know that this is something that can be configured manually as well.
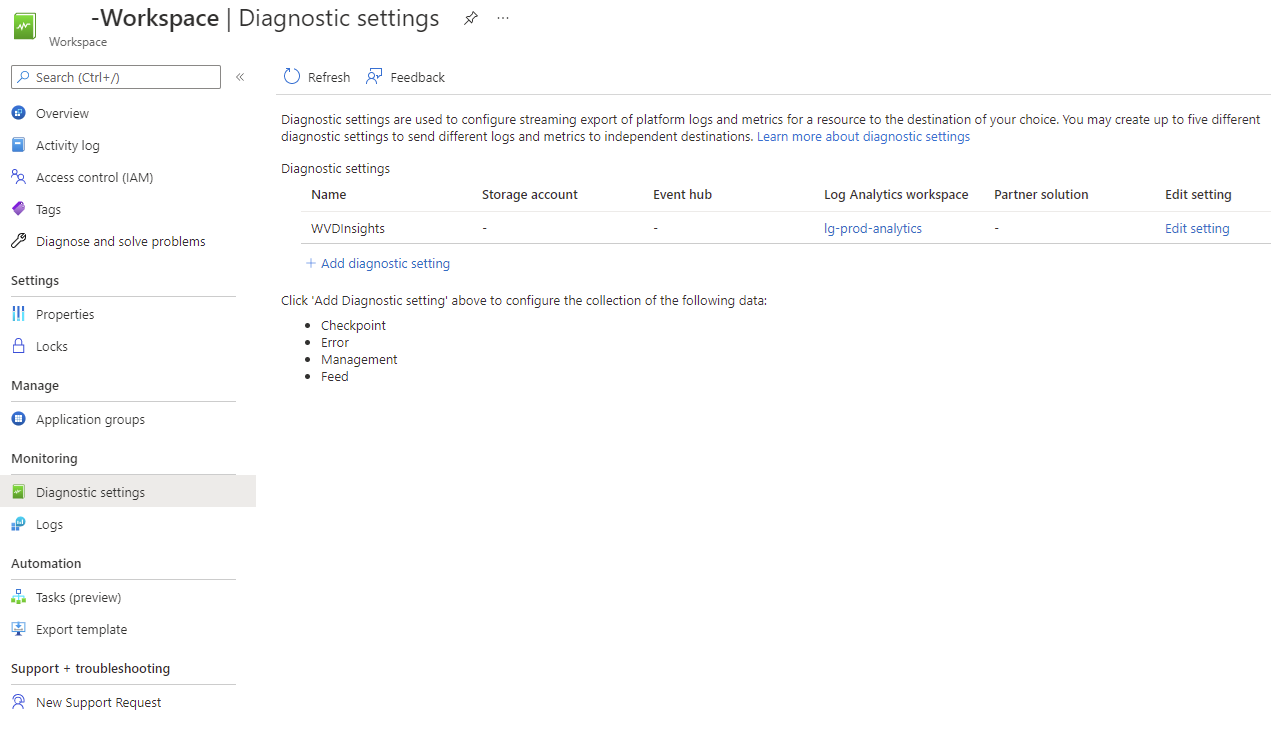
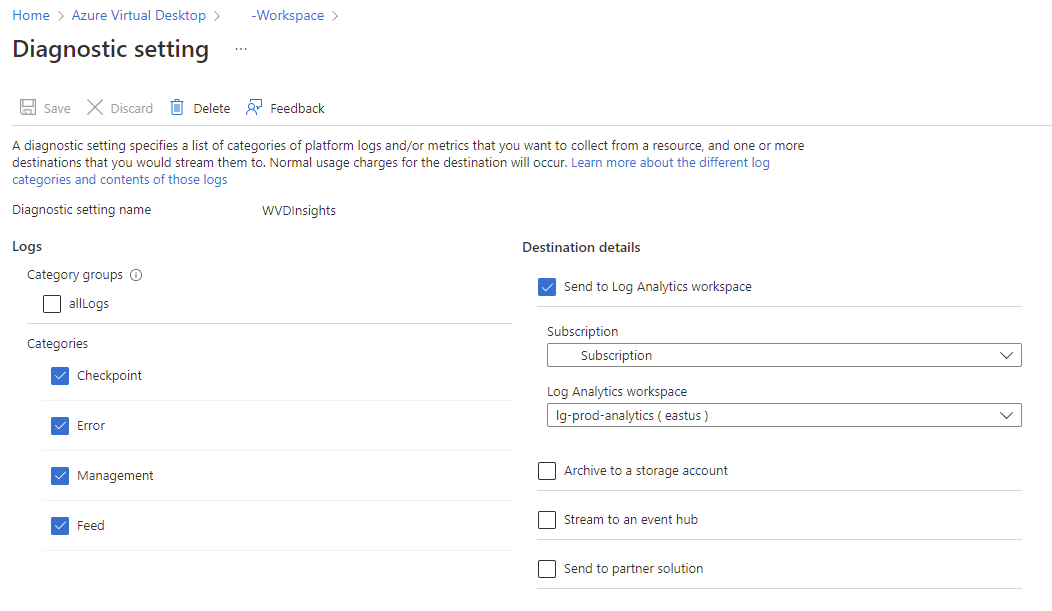
The same is for the Workspace as well:
Adding new Session Hosts to Log Analytics Workspace
It is important to remember to add new session hosts (VDIs) as they are added to the AVD deployment so they are monitored. To add new hosts, navigate to Azure Virtual Desktop > Insights:
A message indicating There are session hosts not sending data to the expected Log Analytics workspace. will be displayed if any are unmonitored. Otherwise the following dashboard will be displayed:
Out-of-the-Box Dashboards
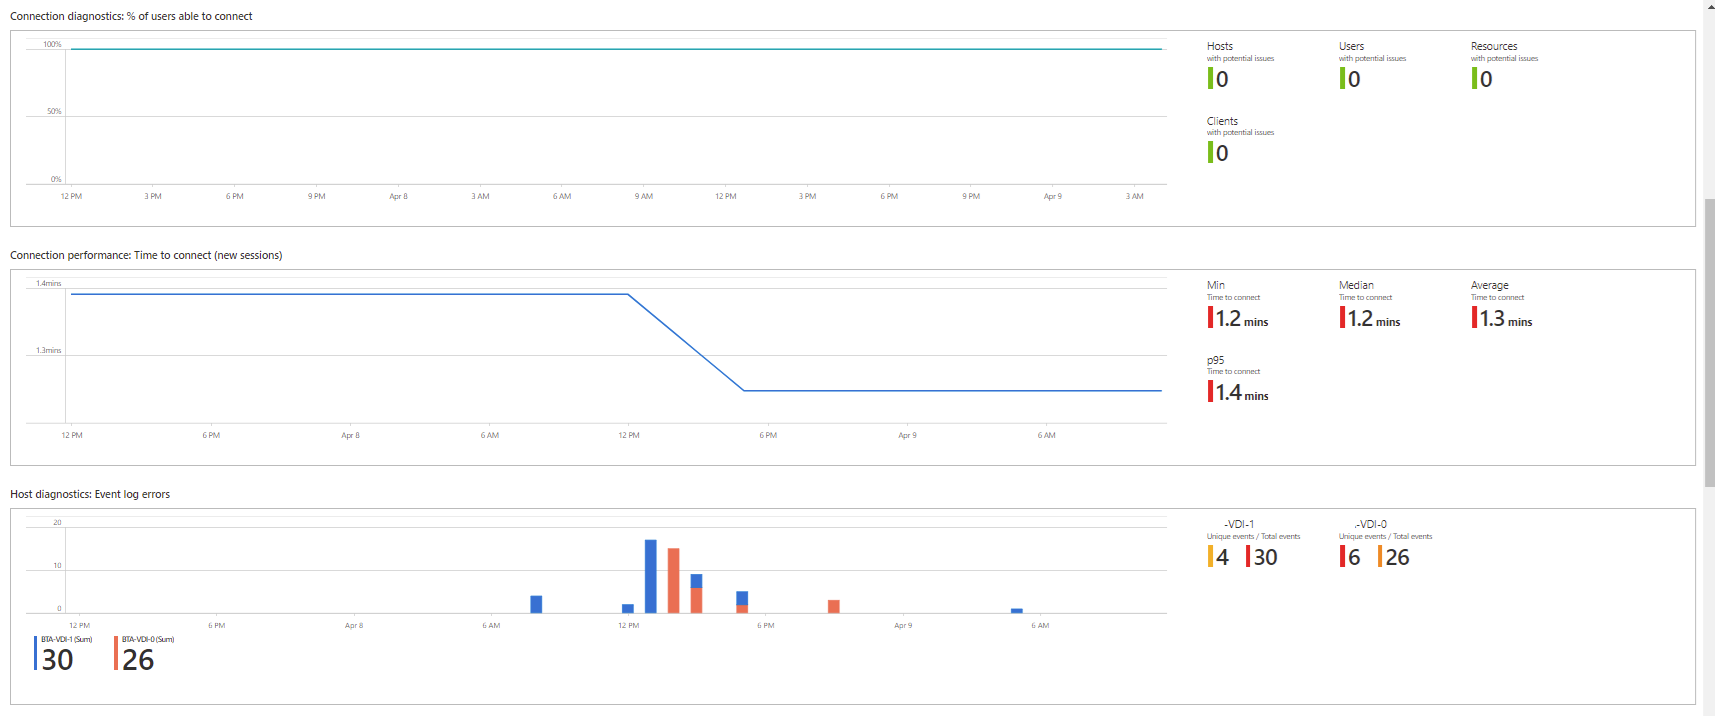
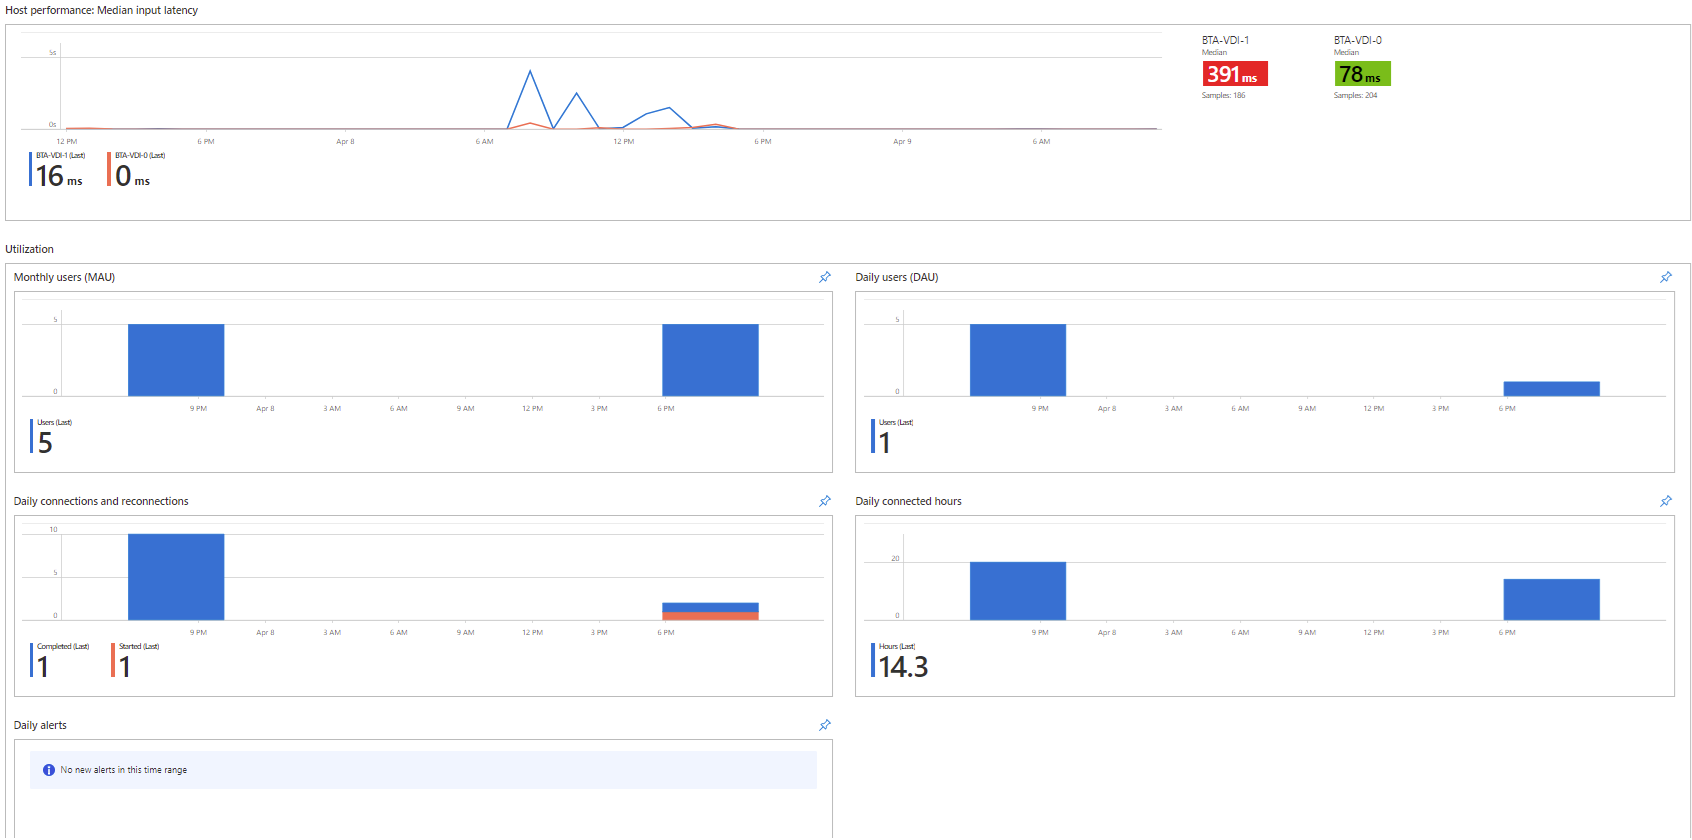
Microsoft provides many out-of-the-box dashboards after completing the configuration.
- Connection diagnostics: % of users able to connect
- Connection performance: Time to connect (new sessions)
- Host diagnostics: Event log errors
- Host performance: Median input latency
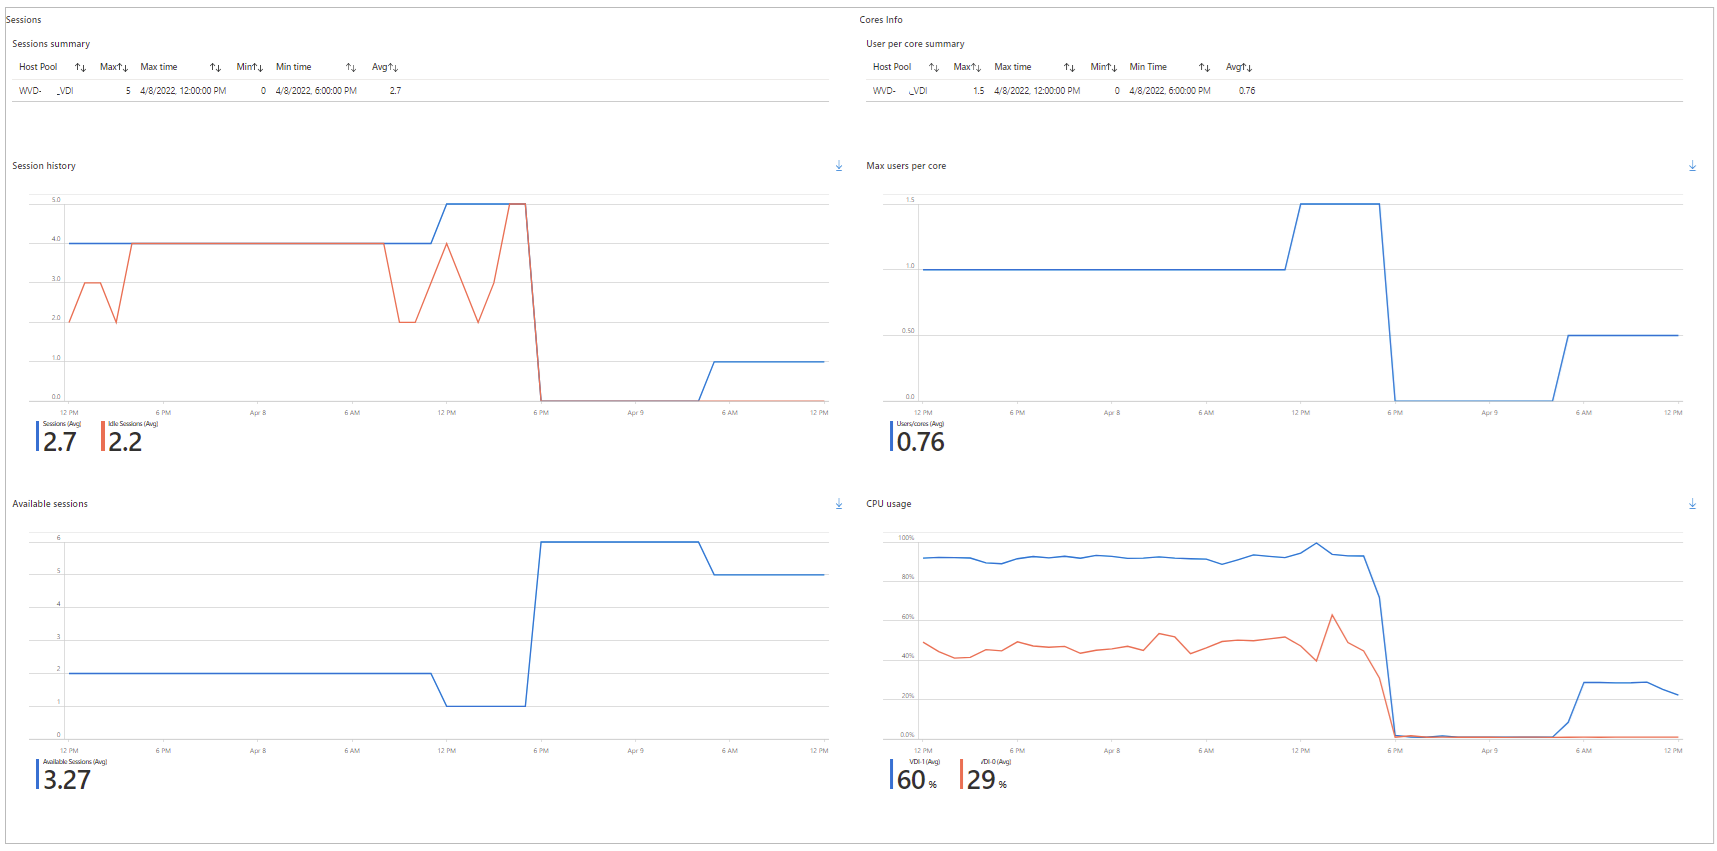
- Utilization
- Daily connections and reconnections
- Daily alerts
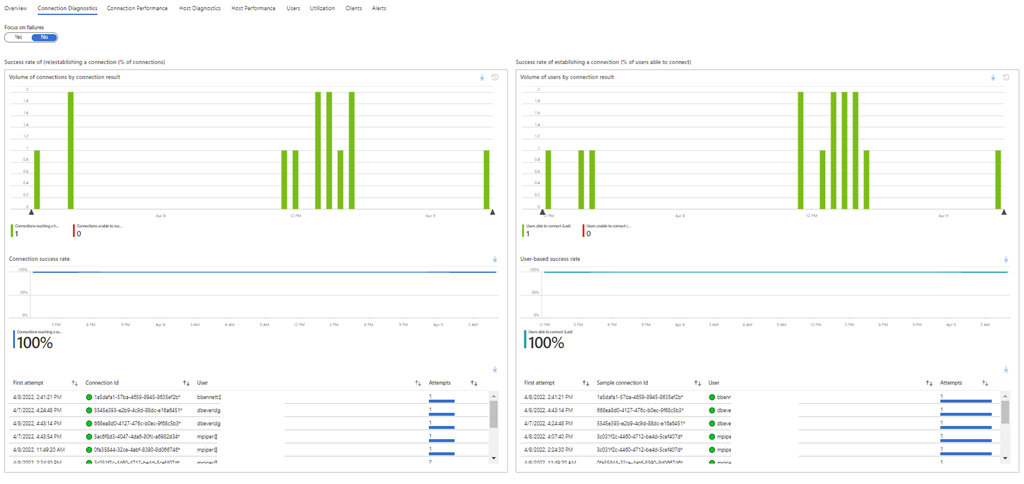
Navigating to the Connection Diagnostics tab will provide the following metrics:
- Success rate of (re)establishing a connection (% of connections)
- Success rate of establishing a connection (% of users able to connect)
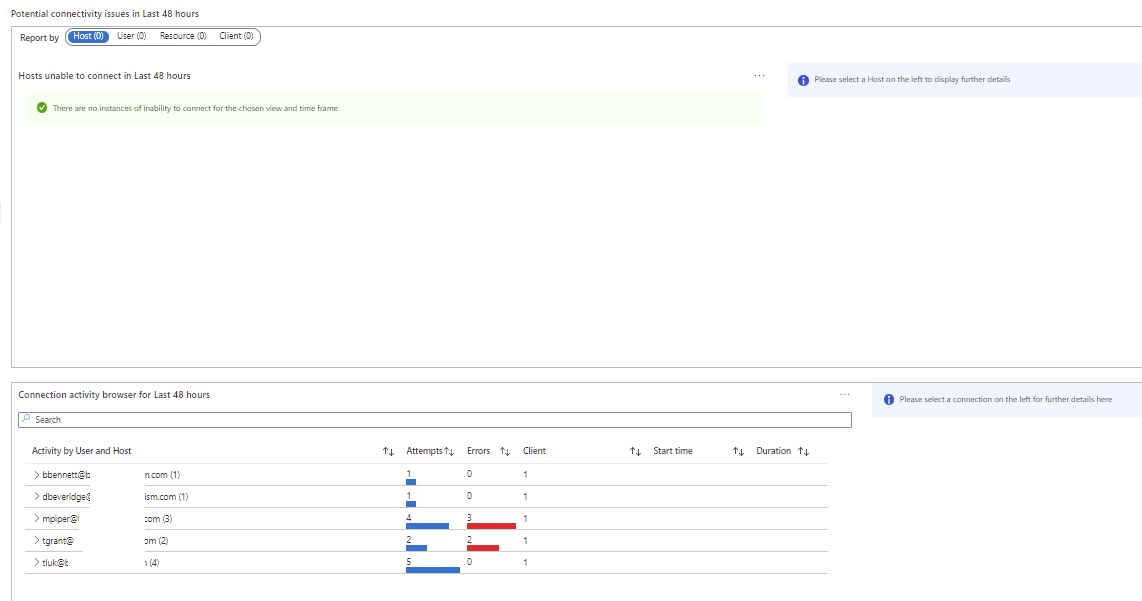
- Potential connectivity issues in Last 48 hours
- Connection activity browser for Last 48 hours
- Ranking of Errors impacting Connection activities in Last 48 hours
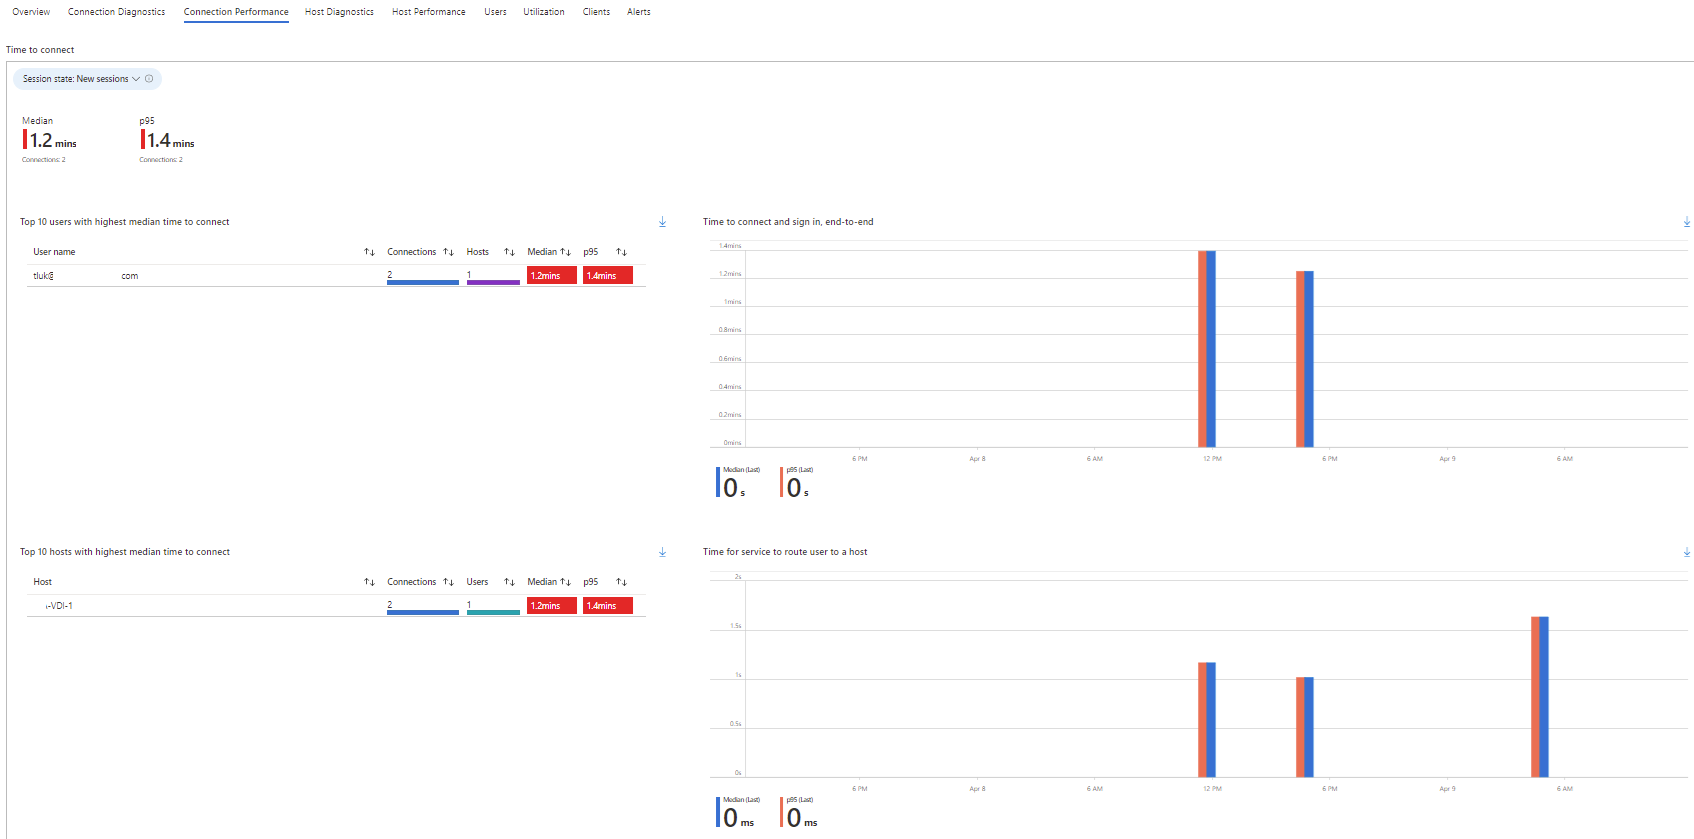
Navigating to the Connection Performance tab will provide the following metrics:
- Top 10 users with highest median time to connect
- Top 10 hosts with highest median time to connect
- Time to connect and sign in, end-to-end
- Time for service to route user to a host
- Round-trip time
- RTT median and 95th percentile for all hosts
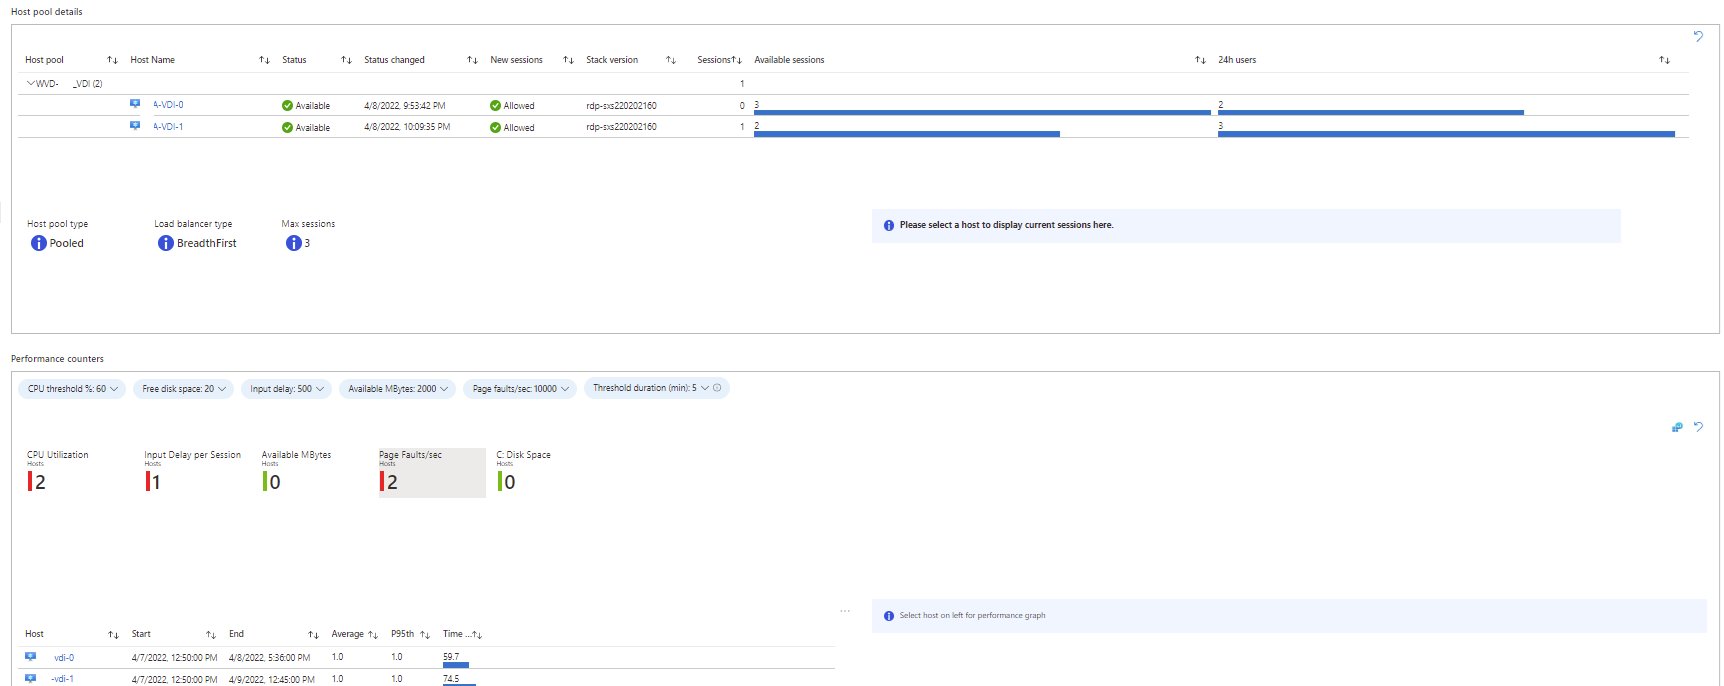
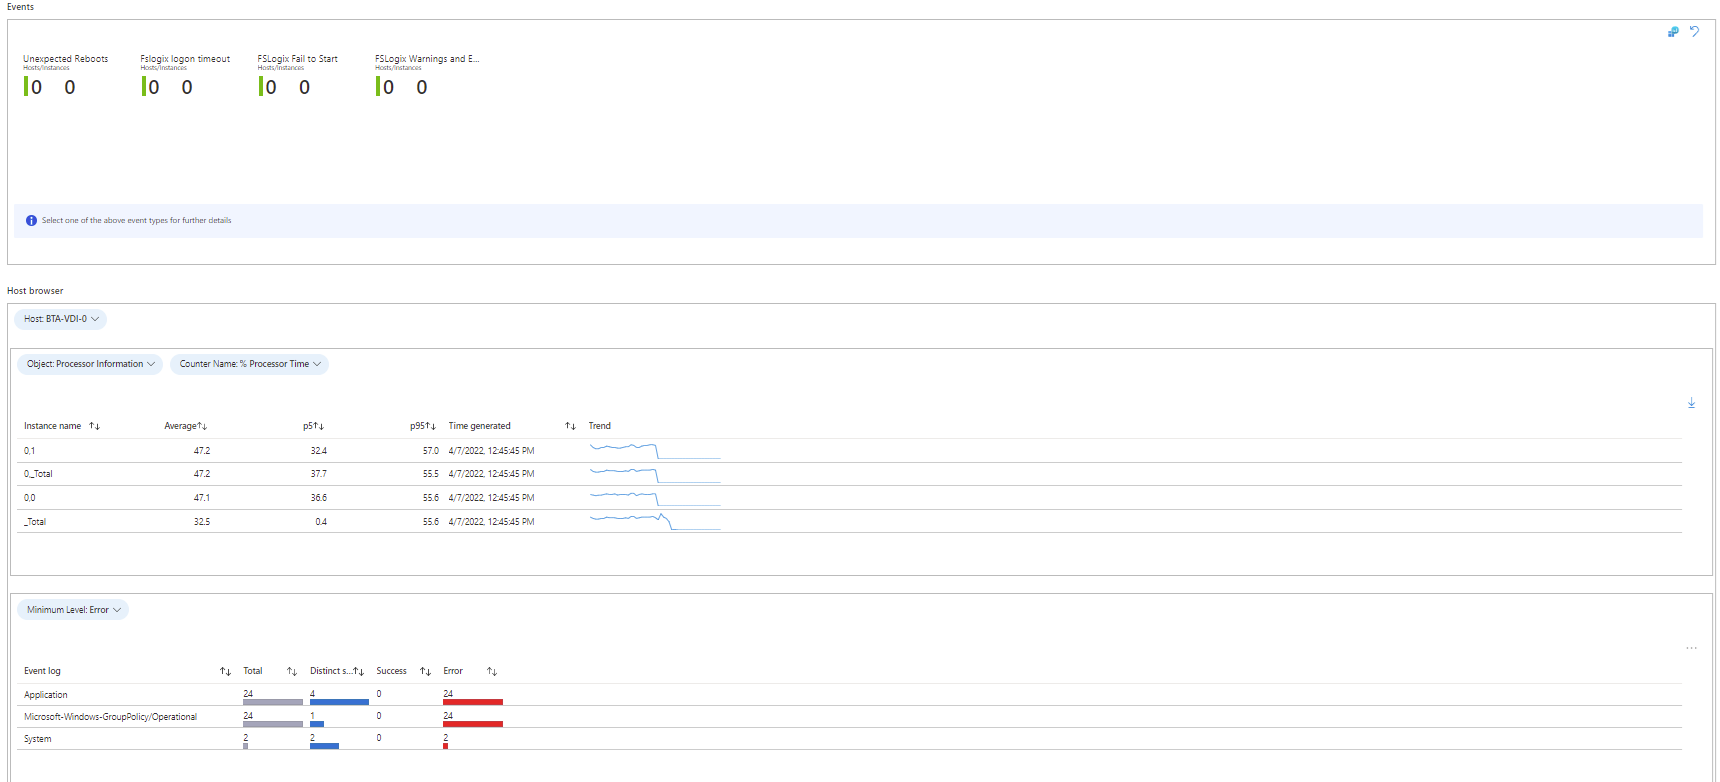
Navigating to the Host Diagnostics tab will provide the following metrics:
- Host pool details
- Performance counters
- Events
- Host browser
- CPU usage
- Available memory
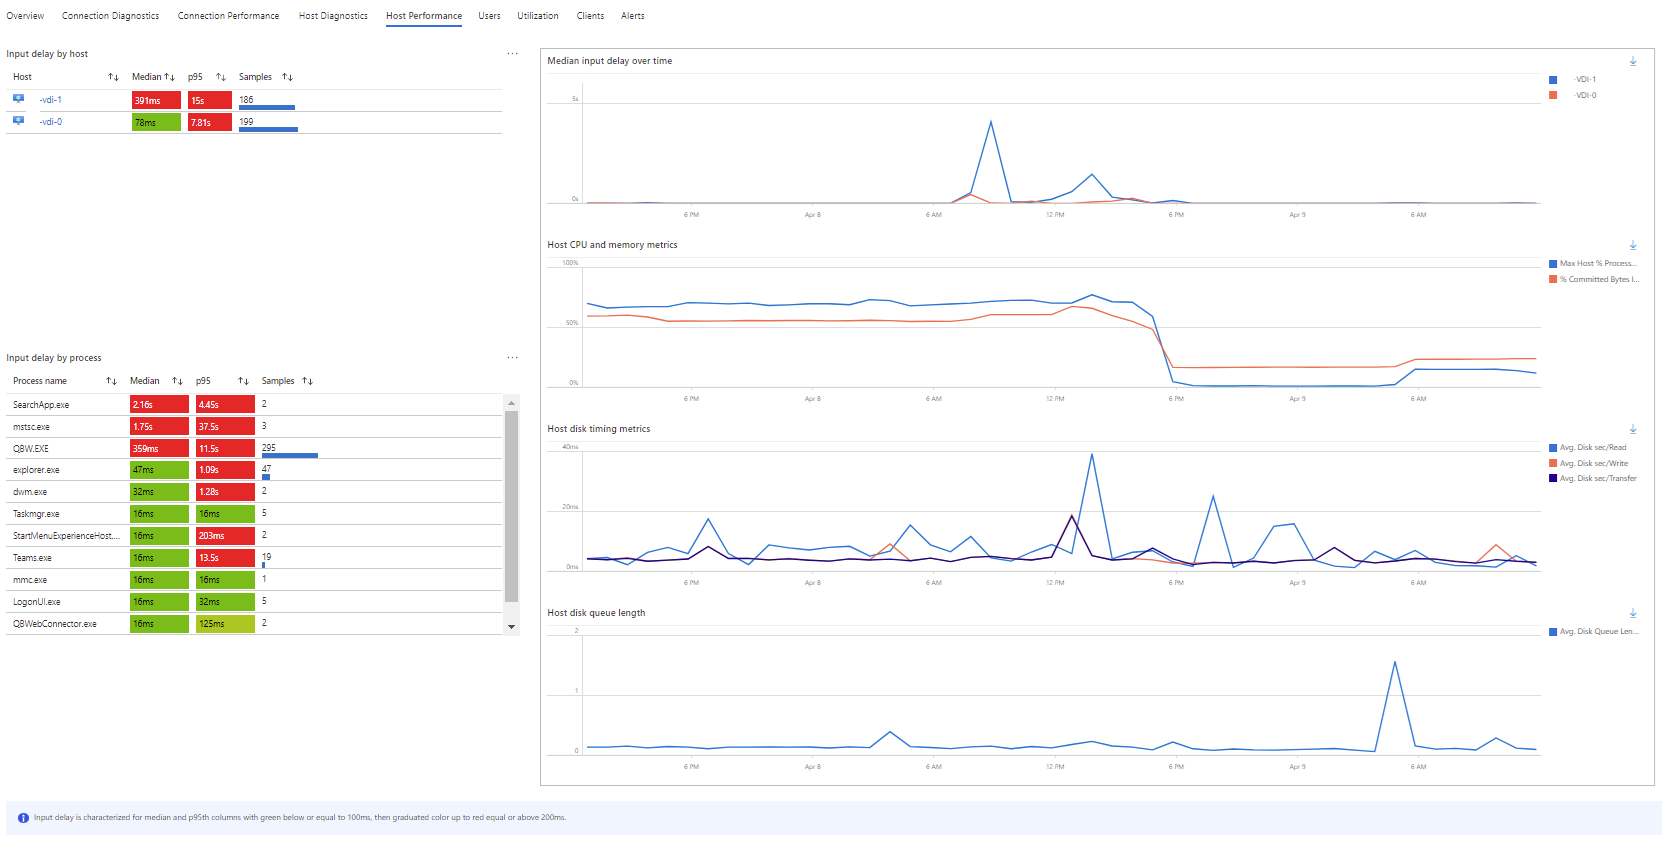
Navigating to the Host Performance tab will provide the following metrics:
- Input delay by host
- Input delay by process
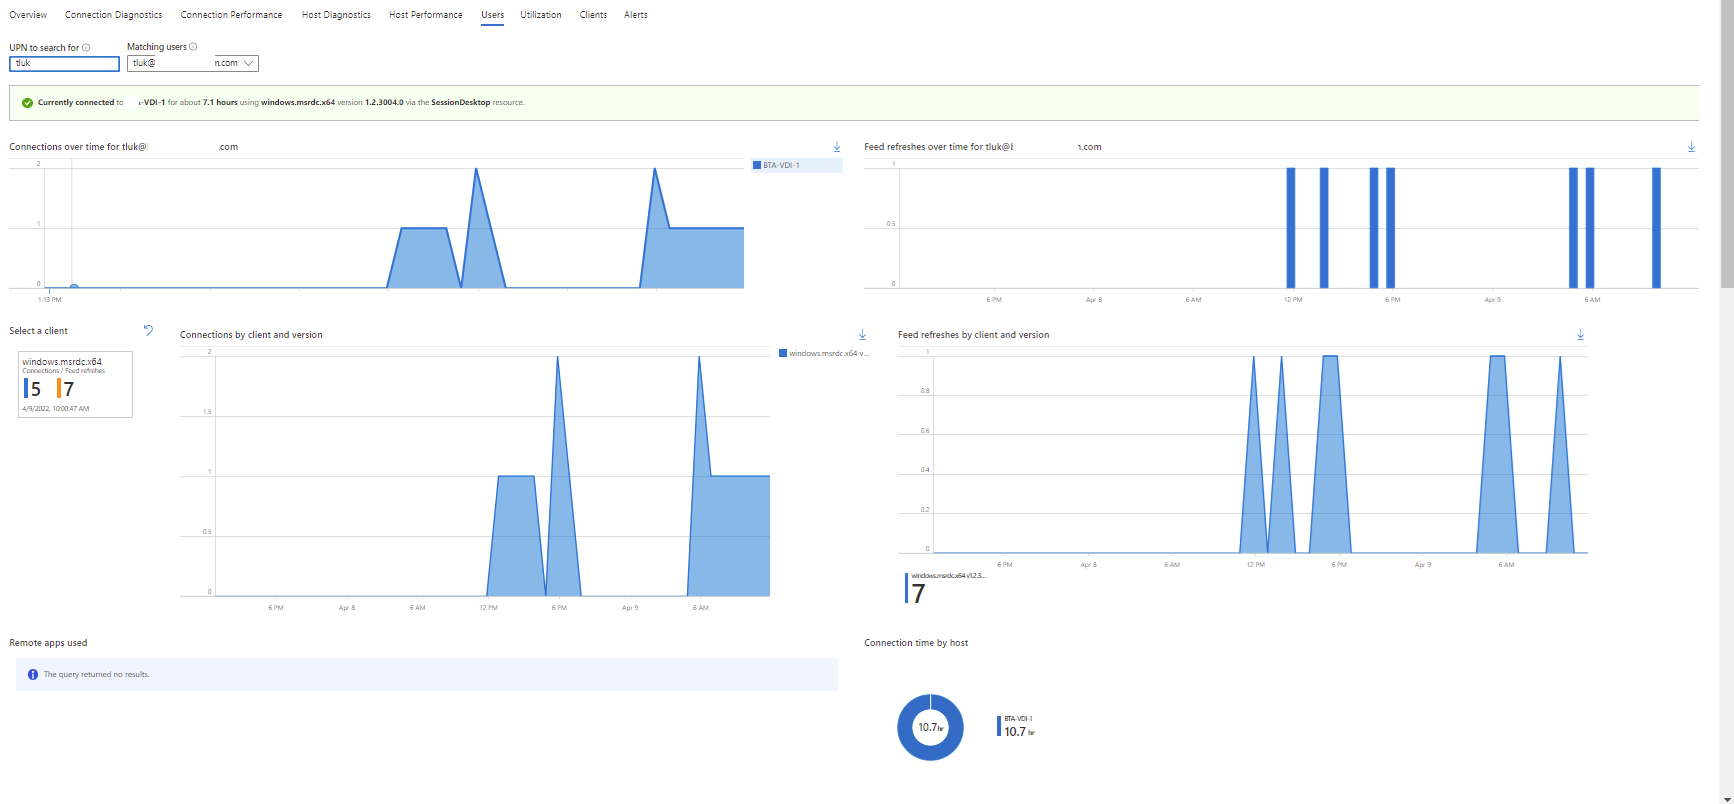
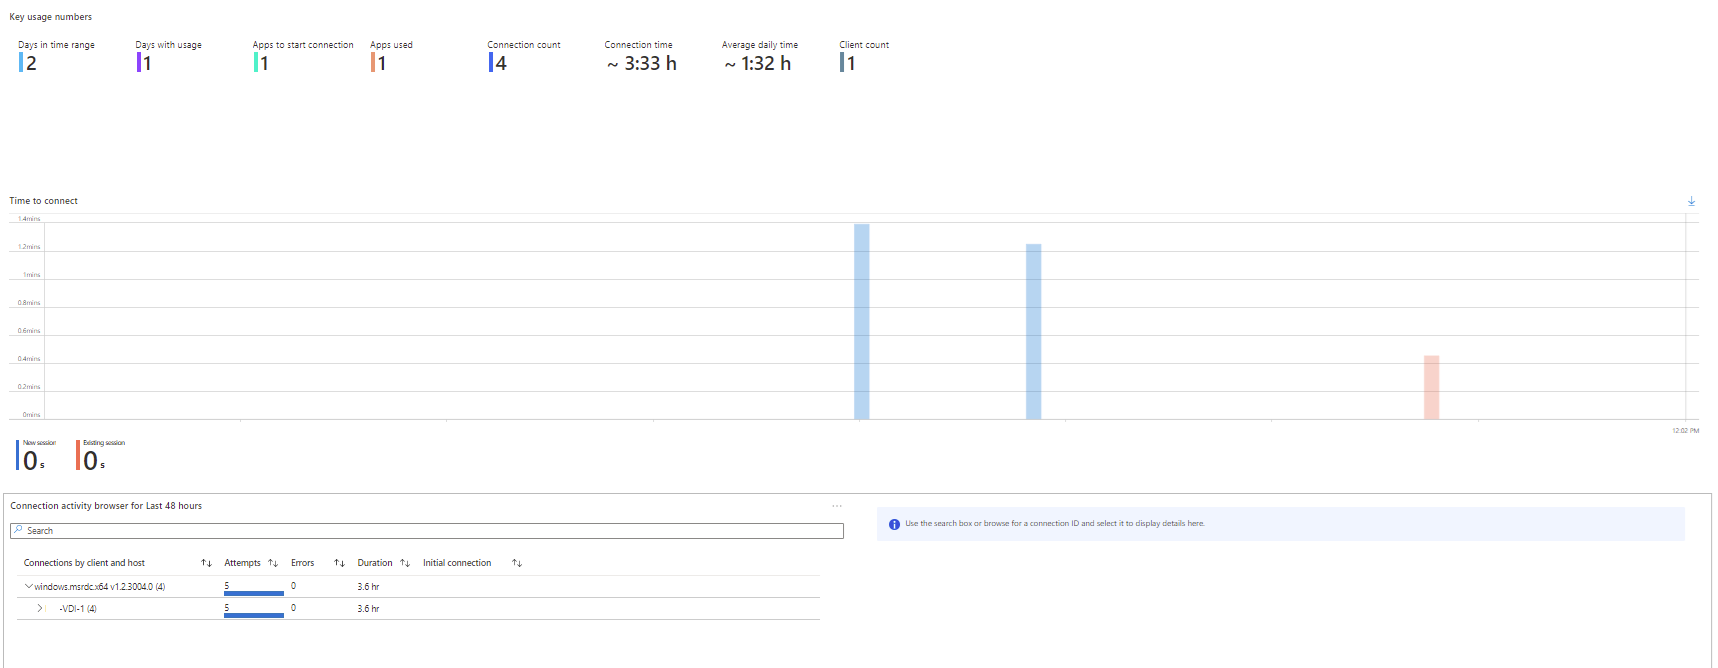
Navigating to the Users tab will allow you to interactively search for a user and then provide the following metrics:
- Connections over time for tluk@contoso.com
- Feed refreshes by client and version
- Feed refreshes over time for tluk@contoso.com
- Connections by client and version
- Key usage numbers
- Connection activity browser for Last 48 hours
- Ranking of errors impacting Connection activities for tluk@contoso.com in Last 48 hours
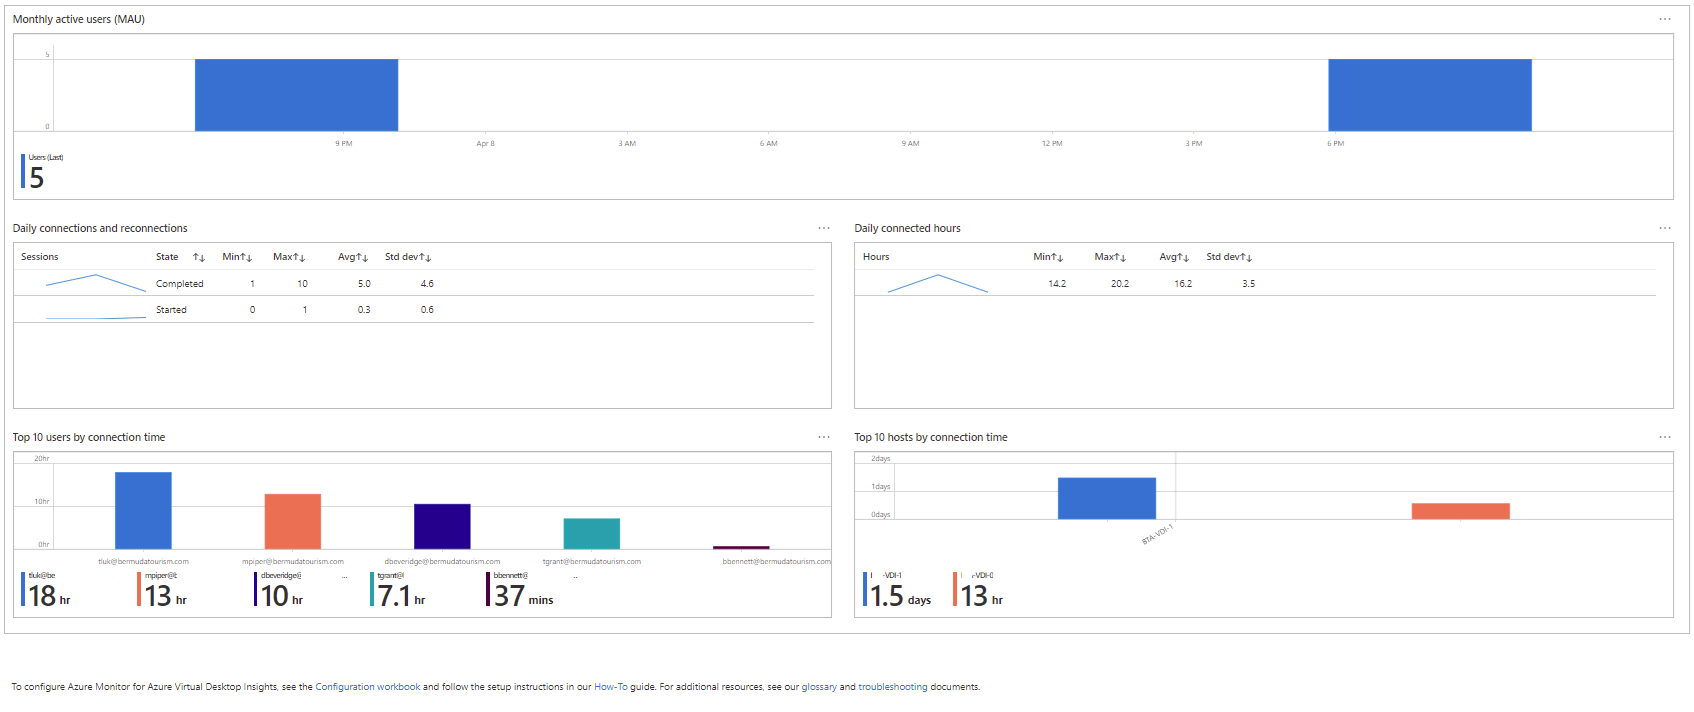
Navigating to the Utilization tab will provide the following metrics:
- Sessions summary
- Max users per core
- Available sessions
- CPU usage
- Monthly active users (MAU)
- Daily connections and reconnections
- Daily connected hours
- Top 10 users by connection time
- Top 10 hosts by connection time
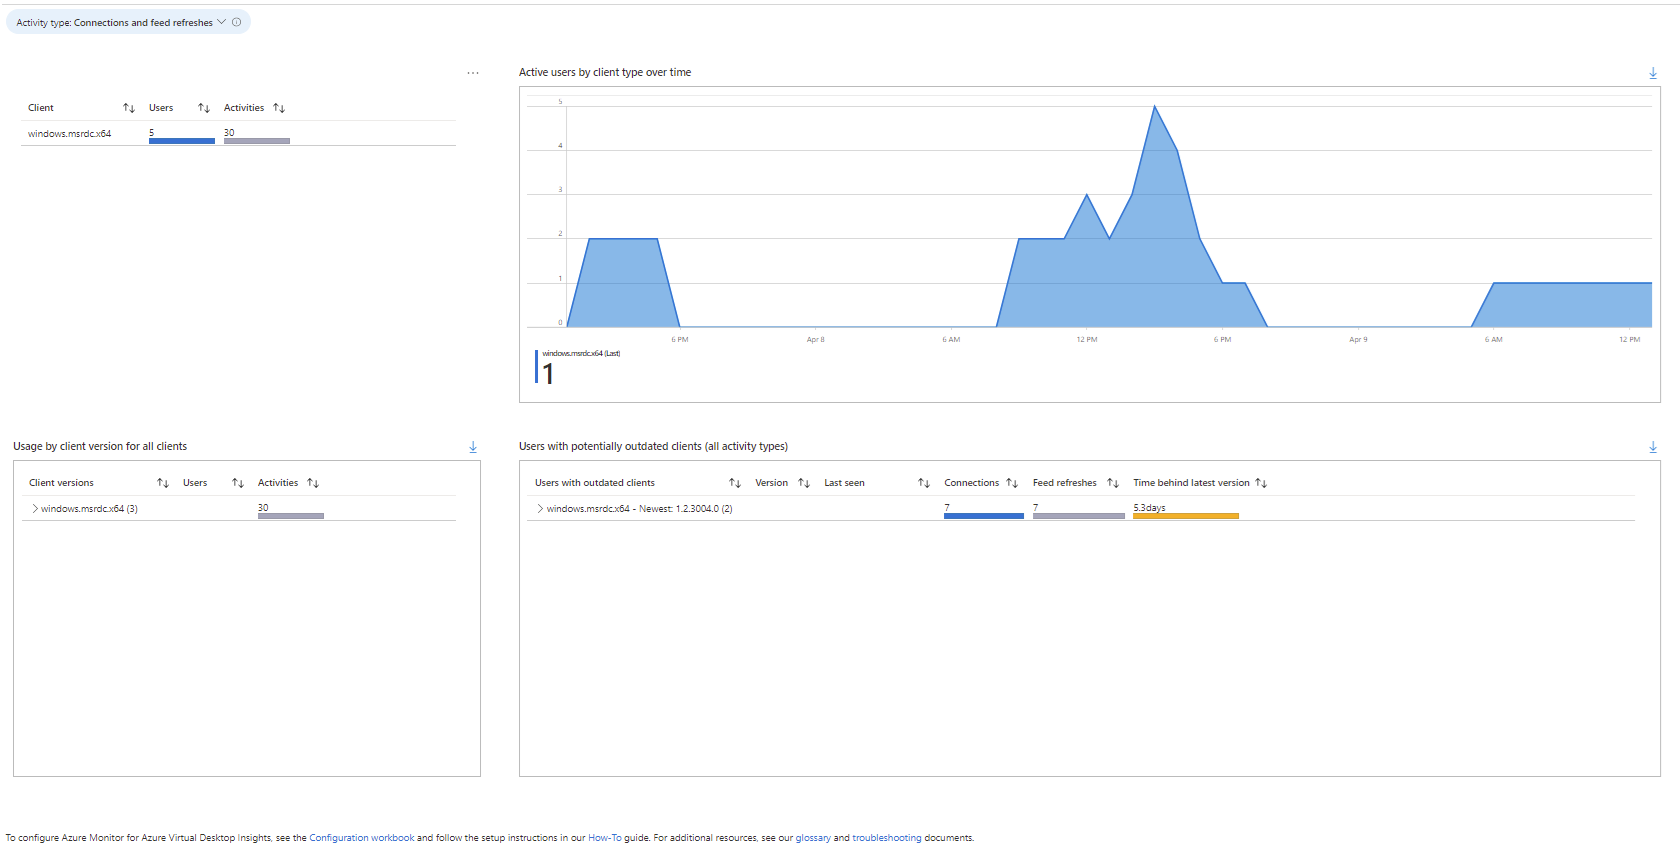
Navigating to the Clients tab will provide the following metrics:
- Active users by client type over time
- Usage by client version for all clients
- Users with potentially outdated clients (all activity types)
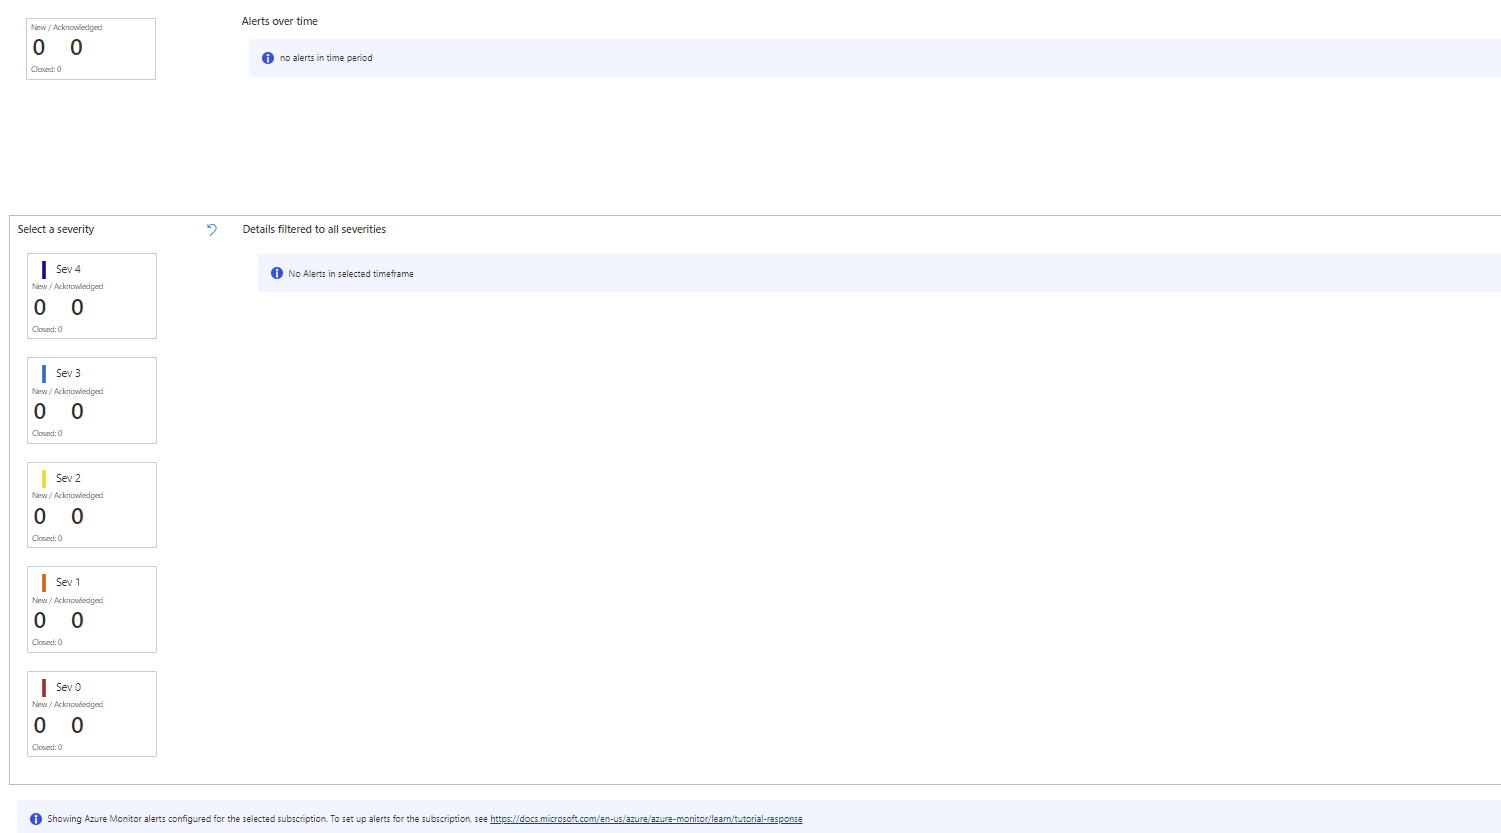
Navigating to the Alerts tab will provide the following metrics:
- Alerts over time
- Details filtered to all severities
And there you have it. It’s truly amazing the amount of dashboards made available with minimal amount of configuration for the environment.
Custom Monitoring of Metrics
I had indicated in one of the previous screenshots that I included the log Microsoft-Windows-GroupPolicy/Operational for the events captured and the reason for this is because I’ve worked in many projects for VDI deployments in the past where the virtual desktop solution was blamed for slow logon performance. One of the metrics I used quick frequent is the GPO processing that the Citrix Director dashboard provides and this value can be easily obtained by capturing the Microsoft-Windows-GroupPolicy/Operational log and using the following kusto queries:
User GPO processing:
// This query will retrieve the amount of time required for computer logon policy processing to complete by parsing ParameterXML
// The logon details can also be retrieved from EventData but we’re using ParameterXml instead to demonstrate how to parse it
Event
| where EventLog == “Microsoft-Windows-GroupPolicy/Operational”
| where Computer contains “Server-or-Desktop-Name”
| where EventID == “8001”
| parse ParameterXml with * “<Param>” GPO_Processing_Seconds “</Param><Param>” Digit1 “</Param><Param>” Server_or_Computer “</Param><Param>” Digit2 “</Param><Param>” Boolean
| project TimeGenerated, Server_or_Computer, GPO_Processing_Seconds, RenderedDescription
Computer GPO processing:
// This query will retrieve the amount of time required for user logon policy processing to complete by parsing ParameterXML
// The logon details can also be retrieved from EventData but we’re using ParameterXml instead to demonstrate how to parse it
Event
| where EventLog == “Microsoft-Windows-GroupPolicy/Operational”
| where Computer contains “Server-or-Desktop-Name”
| where EventID == “8001”
| parse ParameterXml with * “<Param>” GPO_Processing_Seconds “</Param><Param>” Digit1 “</Param><Param>” User “</Param><Param>” Digit2 “</Param><Param>” Boolean
| project TimeGenerated, Computer, User, GPO_Processing_Seconds, RenderedDescription
Other metrics can also be collected using kusto and your imagination is really the limit.
I hope this post served as a good refresher for anyone who hasn’t looked at Azure Virtual Desktop monitoring for a while and would like to know what features are available with minimal configuration. The following are Microsoft Azure Virtual Desktop related documentation I would highly recommend reading:
Sample Kusto Queries:
https://docs.microsoft.com/en-us/azure/virtual-desktop/diagnostics-log-analytics#example-queries
Using Log Analytics to Monitor AVD:
Walkthrough of setting up the diagnostics, events, performance, workbooks:
https://docs.microsoft.com/en-us/azure/virtual-desktop/azure-monitor
Monitoring Virtual Machines:
https://docs.microsoft.com/en-us/azure/azure-monitor/vm/monitor-virtual-machine
Diagnostic Logs References (fields):
WVDConnections
https://docs.microsoft.com/en-us/azure/azure-monitor/reference/tables/wvdconnections
WVDErrors
https://docs.microsoft.com/en-us/azure/azure-monitor/reference/tables/wvderrors
Troubleshoot Azure Monitor for Azure Virtual Desktop
https://docs.microsoft.com/en-us/azure/virtual-desktop/troubleshoot-azure-monitor
Log data ingestion time in Azure Monitor
https://docs.microsoft.com/en-us/azure/azure-monitor/logs/data-ingestion-time

